Velocity-time graphs (Edexcel GCSE Physics): Revision Notes
Velocity-time graphs
Velocity-time graphs show how an object's velocity changes over time.
- The y-axis represents velocity in metres per second (m/s).
- The x-axis represents time in seconds (s).
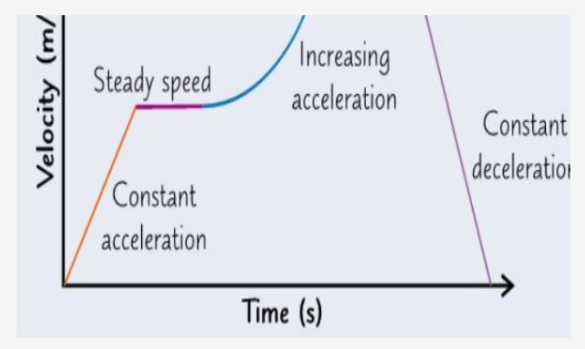
Features of Velocity-Time Graphs
- Steep line = constant acceleration
- Flat line = constant velocity
- Sloping down = deceleration
- Area under the graph = total distance travelled
These graphs help us understand whether an object is accelerating, decelerating, or moving at a constant velocity.
Gradient (Slope)
The gradient of the line on a velocity-time graph tells us the acceleration of the object.
You can calculate the acceleration using this formula:
Where:
- a is the acceleration in metres per second squared (m/s²),
- Δvis the change in velocity in metres per second (m/s),
- t is the time taken in seconds (s).
Distance Travelled
You can find the distance travelled by calculating the area under the curve on a velocity-time graph.
For different shapes, use the appropriate area formulas.
- Area of a Rectangle:
- Area of a Triangle:
- To find the total distance travelled, add the areas of the shapes.
For example,
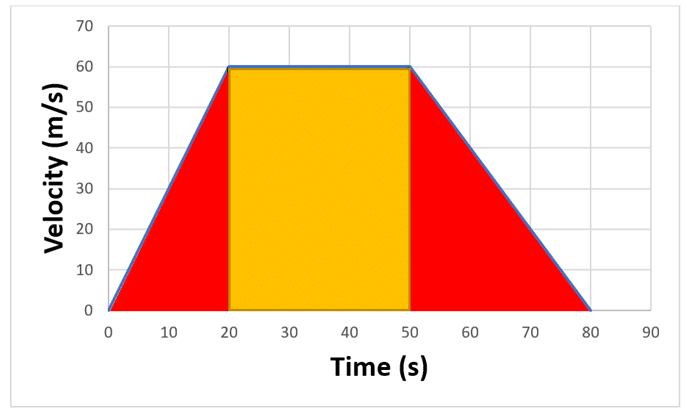
Rectangle:
(50m/s − 20m/s) × (60s−0s) = 30 × 60 = 1800m
Triangle 1: 0.5 × (20m/s − 0m/s)×(60s − 0s)= 0.5 × 20 × 60 = 600m
Triangle 2: 0.5 × (80m/s − 50m/s) × (60s − 0s) = 0.5 × 30 × 60= 900m
Total distance = 1800m + 600m + 900m = 3300m