Boston Matrix and the Product Portfolio (Edexcel A-Level Business): Revision Notes
Boston Matrix and the Product Portfolio
Managing the product portfolio
Understanding product lifecycles reveals a critical business reality: all products eventually experience declining sales. Successful businesses must therefore systematically manage their product portfolio (also called the product mix) by phasing out aging products and launching new ones to maintain continuous revenue streams.
What is a product portfolio?
A product portfolio consists of all the products a business offers to the market. Within this portfolio, products are typically organized into product lines – groups of similar or related products.
For example, a television product line might include flat screen models, HD widescreen versions, and portable televisions. This grouping allows businesses to target different customer segments while maintaining related product offerings.
Strategic portfolio management
Effective portfolio management requires businesses to launch new products at regular intervals, ensuring no "vacuum" occurs when existing products reach the end of their lifecycle. This approach maintains continuous market presence and revenue generation.
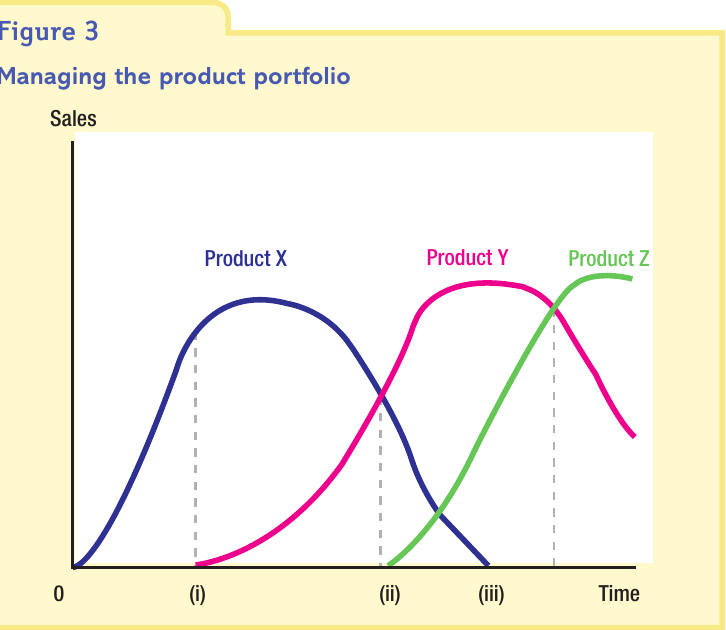
The diagram above illustrates how a business strategically manages three products over time:
- At point (i): Product X is growing while Product Y has just launched
- At point (ii): Product X begins declining, Product Y is growing strongly, and Product Z launches
- At point (iii): Product Y matures as Product Z grows
In practice, businesses manage many more products simultaneously. Mature products generate profits that subsidize the launch costs of new products, which typically make no profit initially due to high development and promotional expenses.
Real-world example: Sweet manufacturers like Nestlé successfully manage extensive product portfolios, including established brands like KitKat, Milkybar, and Yorkie, while continuously launching new products to maintain market interest and revenue.
The Boston Matrix
Purpose and development
A significant challenge in portfolio planning is determining which lifecycle stage a product has reached, as product lifetimes vary considerably. Some products like Heinz baked beans have remarkably long lifecycles, while others like the Sinclair C5 fail quickly.
To address this uncertainty, the Boston Consulting Group developed the Product Portfolio Matrix, commonly known as the Boston Matrix or Growth Share Matrix.
The two criteria
The Boston Matrix categorizes products using two key measures:
1. Market growth rate
This measures how rapidly the overall market is expanding or contracting. Products in fast-growing markets have better growth prospects than those in stagnant or declining markets. The market may be expanding rapidly, growing slowly, or even shrinking.
2. Relative market share
This indicates a product's competitive strength within its market. Rather than using absolute market share, the calculation compares a product's market share against its strongest competitor.
Calculation formula:
Worked Example: Calculating Relative Market Share
Example 1:
- Product X has 10% market share
- Market leader has 40% market share
- Relative market share =
Example 2:
- Product Y is market leader with 50% share
- Next competitor has 25% market share
- Relative market share =
Interpretation: A relative market share above 1.0 indicates market leadership, while below 1.0 suggests a weaker market position.
The four categories
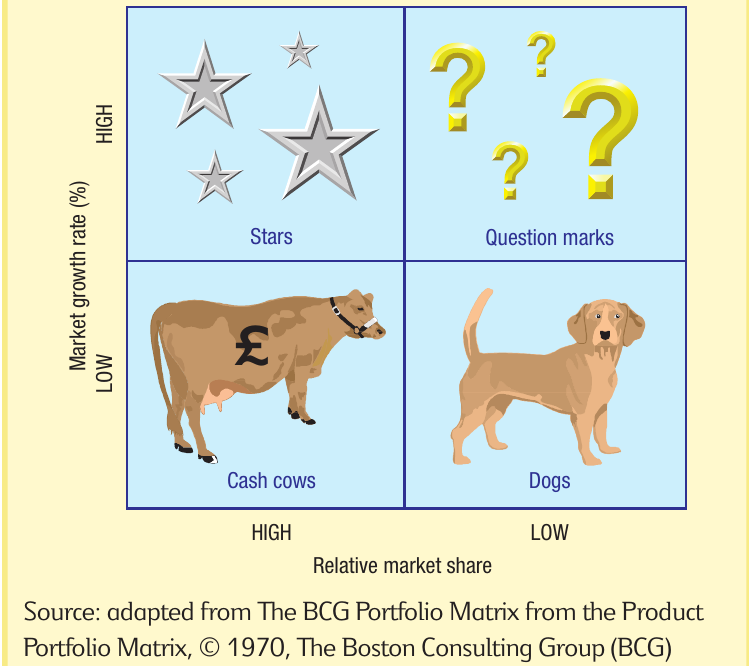
Stars
Stars are products with both high market growth and high relative market share. They represent the most promising products in a portfolio.
Characteristics:
- Strong market position with significant market share
- Operating in rapidly expanding markets
- Already profitable due to strong sales
- Require substantial ongoing investment to maintain position
Cash flow: Approximately zero net cash flow. While profits generate cash inflows, high investment requirements (new facilities, promotional campaigns, competitive responses) create equivalent outflows.
Strategic importance: Stars represent future cash cows and deserve continued investment to build brand strength and defend market position. These are the products that will generate future profits once markets mature.
Cash cows
Cash cows are products with high relative market share but low market growth. They are established, profitable products in mature markets.
Characteristics:
- Strong market position and profitability
- Minimal growth prospects due to market maturity
- Low investment requirements
- Development costs already recovered
Cash flow: Strongly positive net cash flow. High profits with minimal investment needs mean cash cows generate surplus funds for the business.
Strategic importance: Cash cows fund the development of other products. Businesses can either "milk" them for maximum cash or "hold" by maintaining just enough investment to preserve market share. These products are essential for financing the portfolio's future growth.
Question marks
Question marks (also called problem children or wildcats) are products with low relative market share in high-growth markets. They present a strategic dilemma.
Characteristics:
- Weak current market position
- Significant growth potential due to expanding market
- Typically unprofitable at present
- Require investment to capture market growth
Cash flow: Zero or negative net cash flow. Low market share means limited profitability, while the growing market demands investment to maintain sales growth.
Strategic importance: Businesses face critical decisions about whether to invest heavily to convert question marks into stars or to withdraw resources from unpromising products. Not all question marks can be supported – businesses must carefully select which ones merit investment based on market potential and available resources.
Dogs
Dogs are products with both low relative market share and low market growth. They represent the weakest category in the portfolio.
Characteristics:
- Poor competitive position
- Limited future prospects
- Low or zero profitability
- Minimal investment requirements
Cash flow: Zero, slightly positive, or negative. While little investment is needed, profits may be minimal or non-existent.
Strategic importance: Dogs often require divestment decisions unless they serve strategic purposes (e.g., completing a product range, maintaining customer relationships, or supporting other products in the portfolio).
Using the Boston Matrix for portfolio management
Balancing the portfolio
Successful businesses maintain a balanced portfolio across all categories. While avoiding too many Dogs seems obvious, having too many Stars and Question marks also creates problems.
Why balance matters:
- Stars and Question marks drain resources during development and growth phases
- Cash cows generate the surplus cash needed to fund products in growing markets
- Future Cash cows emerge from today's Stars and successful Question marks
- A portfolio with only Cash cows lacks future growth potential
- A portfolio with only Stars and Question marks faces cash flow problems
The ideal portfolio includes sufficient Cash cows to fund the development of Stars and selected Question marks that will become tomorrow's Cash cows. This creates a sustainable cycle of revenue generation and reinvestment.
Strategic decisions for each category
Stars:
- Build strategy: Invest heavily to increase sales and market share
- Strengthen brand positioning to maintain competitive advantage
- Defend against competitive threats
- Focus on converting Stars into future Cash cows
Cash cows:
- Milk strategy: Extract maximum cash with minimal investment
- Hold strategy: Maintain market position with moderate spending on promotion and development
- Use generated cash to support other products
- Avoid over-investment as growth potential is limited
Question marks:
- Build strategy: Invest aggressively to increase market share and convert to Stars
- Harvest strategy: Raise prices and reduce promotion to maximize short-term profits
- Divest strategy: Withdraw or sell unprofitable products with poor prospects
- Carefully evaluate which Question marks merit investment
Dogs:
- Divest strategy: Discontinue or sell if unprofitable
- Harvest strategy: Extract remaining value before withdrawal
- Consider strategic reasons for retention (brand completeness, customer expectations)
Exam technique: applying the Boston Matrix
How to analyze products using the Boston Matrix:
- Identify the category by assessing both market growth and relative market share
- Explain the characteristics (profitability, cash flow, investment needs)
- Recommend appropriate strategies (build, hold, milk, harvest, divest)
- Justify your recommendation using evidence about market conditions and business objectives
- Consider the broader portfolio – how does this product fit with others?
Evaluation points:
- The Matrix simplifies complex market realities
- Accurate market data may be difficult to obtain
- Products don't always fit neatly into categories
- Strategic decisions depend on business circumstances and resources
- Future market changes can shift product positions
Remember!
Key Points to Remember:
- Businesses must manage their product portfolio to maintain continuous revenue as products decline
- The Boston Matrix categorizes products using market growth rate and relative market share
- Stars (high growth, high share) are future Cash cows requiring investment to build brand strength
- Cash cows (low growth, high share) generate surplus cash to fund other products
- Question marks (high growth, low share) require decisions about whether to invest, harvest, or divest
- Dogs (low growth, low share) typically need harvesting or divestment
- A balanced portfolio includes Cash cows funding the development of Stars and selected Question marks
Key Terms:
- Product portfolio: All products offered by a business
- Product line: Group of similar products
- Relative market share: Product's market share ÷ Leading competitor's market share
- Build: Strategy to increase market share through investment
- Hold: Strategy to maintain market position with moderate investment
- Milk: Strategy to extract maximum cash from a product
- Harvest: Strategy to maximize short-term profits by reducing costs
- Divest: Strategy to withdraw or sell a product
Critical Formula:
A value above 1.0 indicates market leadership.