11 – To Evaluate Primary or Secondary Data Relating to the Effects of Human Activity on Species Diversity (LC 2027) (Leaving Cert Biology): Revision Notes
11 – To Evaluate Primary or Secondary Data Relating to the Effects of Human Activity on Species Diversity
Understanding biodiversity evaluation
Evaluating the effects of human activity on species diversity involves examining both primary data (collected directly through research) and secondary data (information from existing studies and databases). Scientists use various methods to measure how human actions impact the variety of life on Earth, from individual species to entire ecosystems.
The two main approaches for assessing human impacts on biodiversity include examining extinction risk across different species groups and analysing land use patterns that show how humans have modified natural habitats.
The combination of primary and secondary data sources provides a comprehensive view of biodiversity changes, allowing scientists to identify patterns across different scales and time periods.
Current extinction risk across species groups
The International Union for Conservation of Nature (IUCN) Red List provides a standardised system for evaluating species' conservation status. This system categorises species into different threat levels:
- Least Concern: Species with stable populations
- Near Threatened: Species approaching vulnerable status
- Vulnerable: Species facing high risk in the wild
- Endangered: Species facing very high risk of extinction
- Critically Endangered: Species facing extremely high risk of extinction
- Extinct in the Wild: Species surviving only in captivity
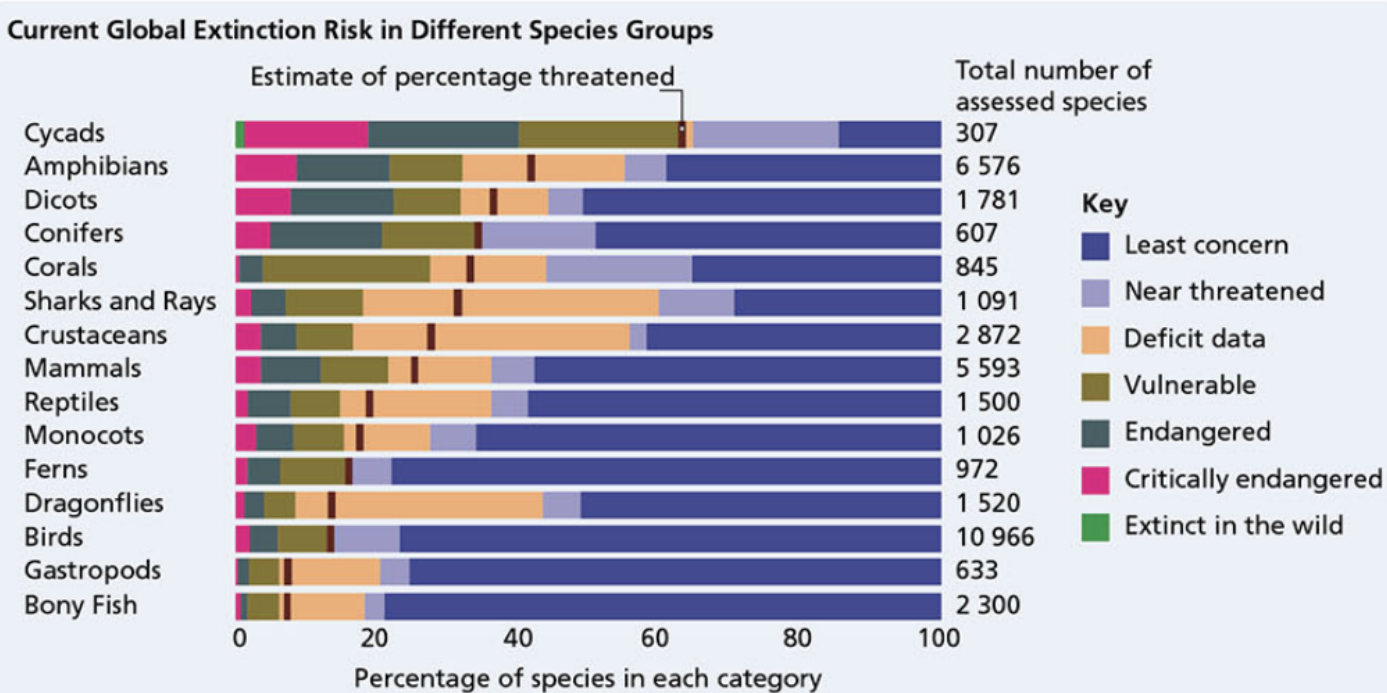
When examining extinction risk across different taxonomic groups, clear patterns emerge. Cycads (ancient seed plants) show the highest proportion of threatened species, with most falling into critically endangered or endangered categories. Amphibians also face severe threats, with a large percentage classified as vulnerable or worse.
Plant groups such as dicots and conifers show significant vulnerability, whilst mammals and reptiles display concerning levels of threat. In contrast, some groups like bony fish and birds have larger proportions in the least concern category, though substantial numbers still face threats.
This data reveals that human activities affect different species groups unequally, with some taxa being particularly susceptible to anthropogenic pressures. Ancient lineages like cycads and environmentally sensitive groups like amphibians face the greatest threats.
Historical trends in species extinctions
Understanding how extinction rates have changed over time provides crucial evidence of accelerating biodiversity loss. The natural or background extinction rate typically ranges from 0.1 to 2 extinctions per million species per year. However, current data suggests we are experiencing extinctions at a rate of approximately 34 extinctions per million species per year - representing a dramatic acceleration.
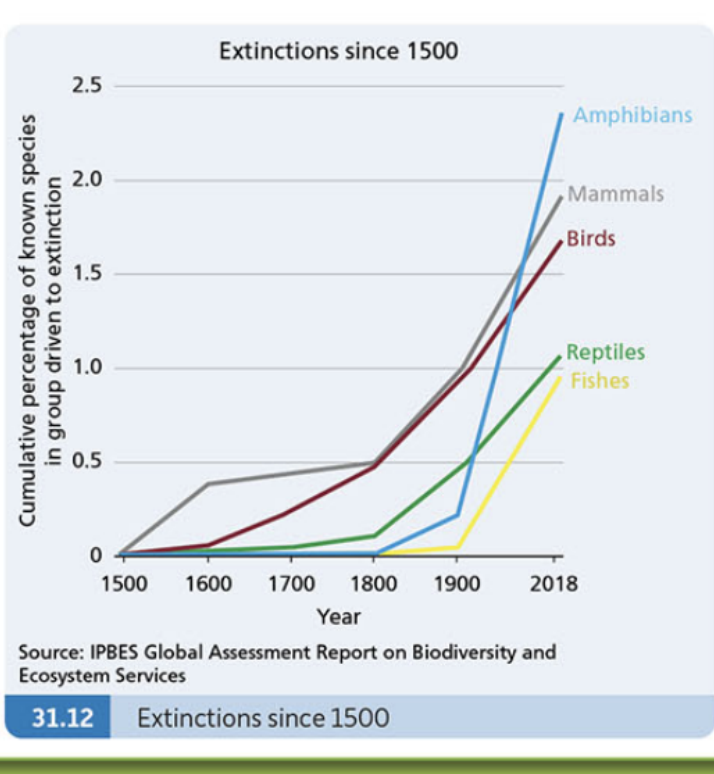
Historical records since 1500 show alarming trends across vertebrate groups. Amphibians demonstrate the steepest extinction curve, reaching approximately 2.3% cumulative extinction by 2018. Mammals follow closely with around 1.9% cumulative extinction, whilst birds show approximately 1.7% cumulative extinction.
The data reveals that most dramatic increases in extinction rates occurred after 1900, coinciding with rapid industrialisation, population growth, and intensification of human activities. This acceleration suggests that human impacts on biodiversity have intensified significantly in recent centuries.
Critical Acceleration in Extinction Rates
Documentation shows at least 680 confirmed extinctions and a further 750 possible extinctions among 112,400 assessed species over the past 500 years. This represents a 17-34 times increase over natural background extinction rates, providing clear evidence of human-driven biodiversity crisis.
Human land use impacts on biodiversity
Land use change represents one of the most significant drivers of biodiversity loss. Human activities now directly affect more than 70% of Earth's ice-free surface, fundamentally altering natural ecosystems and species habitats.
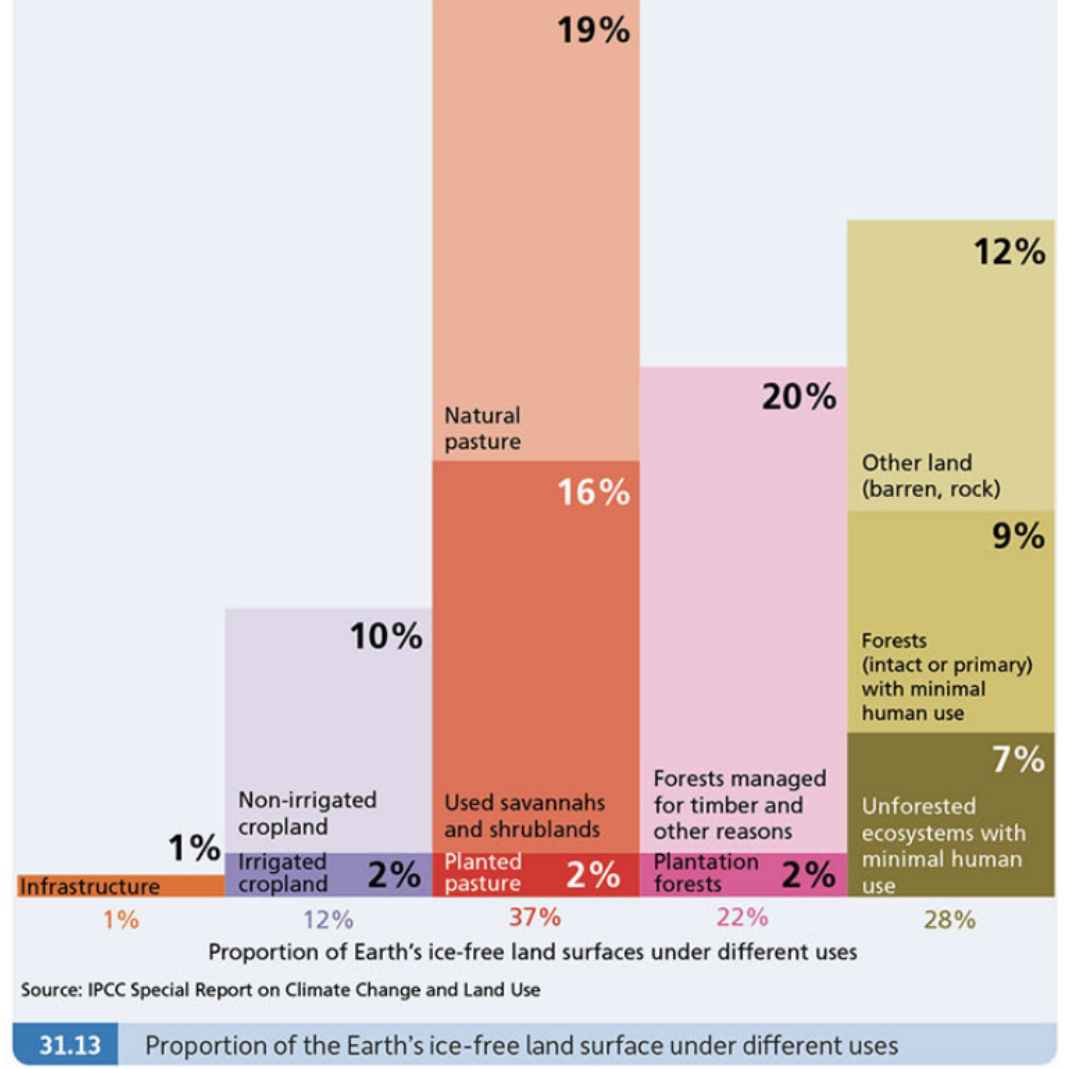
The distribution of Earth's ice-free land surface reveals the extent of human modification:
- Grazing land (natural and planted pastures) accounts for approximately 37% of the surface
- Forests under various management levels comprise about 22% of the surface
- Cropland (both irrigated and non-irrigated) covers around 12% of the surface
- Infrastructure and urban areas occupy approximately 1% of the surface
- Other uses including barren land account for the remaining 28%
Infrastructure and intensively managed areas (including cropland, pasture, and managed forests) now occupy more than half of Earth's ice-free land surface. This extensive modification has profound implications for species diversity, as natural habitats become fragmented, degraded, or completely replaced.
Wilderness Confinement
Wilderness areas with minimal human interference are now largely confined to extreme environments such as the Arctic regions, Amazon Rainforest, Sahara Desert, and Australian interior. This confinement of wilderness to marginal areas means that many species adapted to more temperate or accessible habitats face increasing pressure.
Key findings and implications for species diversity
The evaluation of both extinction risk and land use data reveals several critical patterns:
Species vulnerability varies significantly across taxonomic groups, with plants like cycads and vertebrates like amphibians showing particularly high extinction risk. This variation suggests that conservation strategies need to be tailored to different species groups based on their specific vulnerabilities.
Extinction rates have accelerated dramatically, increasing from natural background levels to rates that are 17-34 times higher than historical norms. This acceleration has been most pronounced since 1900, indicating that modern human activities pose unprecedented threats to biodiversity.
Human land use has transformed the majority of Earth's surface, leaving only small wilderness areas intact. This transformation creates a landscape where species must adapt to human-modified environments or face local extinction.
The combination of direct habitat loss and global environmental changes creates multiple pressures on species simultaneously, making recovery more difficult and extinction more likely.
These findings demonstrate that human activities have fundamentally altered the trajectory of life on Earth, creating what many scientists term the "sixth mass extinction". The data provides clear evidence that urgent conservation action is needed to prevent further biodiversity loss.
Key Points to Remember:
- Current extinction rates are 17-34 times higher than natural background rates, providing clear evidence of human impact on species diversity
- Cycads and amphibians represent the most threatened groups, whilst different taxonomic groups show varying levels of vulnerability to human activities
- Over 70% of Earth's ice-free surface is directly affected by human use, leaving wilderness areas confined to extreme environments like deserts and polar regions
- Historical data since 1500 shows accelerating extinction rates, with the steepest increases occurring after 1900 during rapid industrialisation
- Multiple data sources including IUCN Red List assessments and land use surveys provide complementary evidence for evaluating human impacts on biodiversity