14 – To Investigate Quantitatively the Impact of Variation in Abiotic Factors on the Distribution and Abundance of a Species (LC 2027) (Leaving Cert Biology): Revision Notes
14 – To Investigate Quantitatively the Impact of Variation in Abiotic Factors on the Distribution and Abundance of a Species
What are abiotic factors?
Abiotic factors are non-living environmental conditions that significantly influence where organisms live and how many can survive in a particular habitat. These physical and chemical factors create the environmental conditions that determine which species can thrive in different ecosystems.
Understanding how abiotic factors affect organisms is crucial because they directly impact:
- Distribution: Where organisms are found in an ecosystem
- Abundance: The number of organisms present in a specific area
The relationship between abiotic factors and organism survival is fundamental to ecology. Changes in these non-living factors can dramatically alter which species can survive in an area and in what numbers.
Key abiotic factors and their measurement
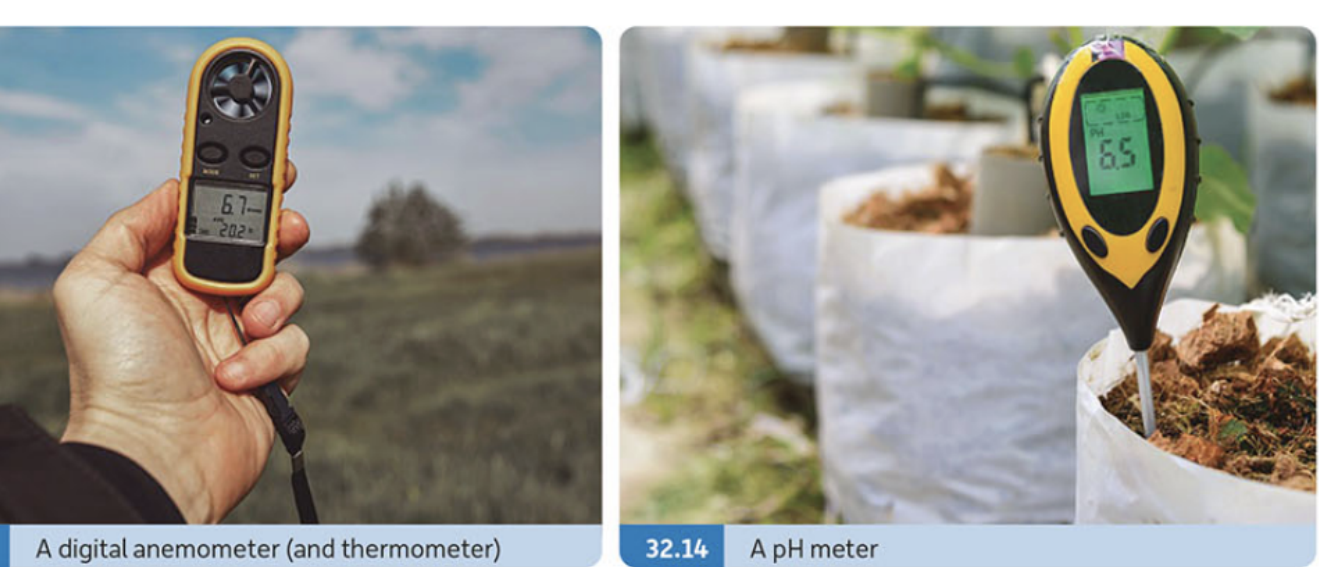
Scientists can measure various abiotic factors to understand their impact on living organisms. Each factor requires specific equipment and techniques for accurate measurement:
Important abiotic factors include:
- Light intensity - affects photosynthesis and plant growth patterns
- Soil pH - influences nutrient availability and plant species composition
- Soil water content - determines which plants can survive in different areas
- Temperature (both soil and air) - affects metabolic rates and species survival
- Rainfall - influences water availability for all organisms
- Wind speed - affects plant growth and seed dispersal
- Aspect - the direction a habitat faces, influencing sunlight exposure
Each abiotic factor requires specific measuring equipment and techniques. Using the wrong method or equipment can lead to inaccurate results and false conclusions about species distribution patterns.
Investigation methods for studying abiotic factor impacts
Quadrat sampling method
Quadrats are square frames used to sample small areas systematically. This method works well for studying plants and slow-moving animals like woodlice or snails.
Key steps for quadrat sampling:
- Place quadrats either randomly or along a systematic line (transect)
- Measure the relevant abiotic factor in each quadrat location
- Count organisms or estimate percentage cover within each quadrat
- Record data in a systematic table for analysis
Random sampling ensures unbiased results by throwing an object (like a small ball) over your shoulder to determine quadrat placement. This prevents you from unconsciously choosing locations that might affect your results.
Random sampling is essential for obtaining reliable scientific data. Any bias in quadrat placement could lead to results that don't accurately represent the true relationship between abiotic factors and species distribution.
Transect methods
Line transects involve stretching a rope or measuring tape across a habitat and recording organisms that touch the line at regular intervals (usually every 1 metre). This method helps study how species change along an environmental gradient.
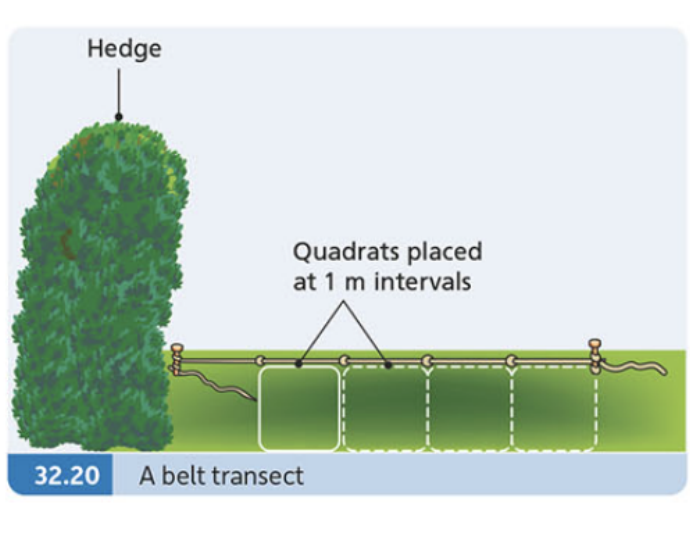
Belt transects combine line transects with quadrat sampling by placing quadrats at regular intervals along the transect line. This provides more detailed information about species abundance and environmental conditions.
Capture-recapture method
For studying mobile animals like mammals, birds, or fish, the capture-recapture method estimates population sizes without counting every individual.
The process involves:
- Capture a sample of animals and mark them safely (without causing harm)
- Release the marked animals back into their habitat
- Allow time for the animals to mix with the unmarked population
- Recapture a second sample and count how many are marked
Population estimation formula:
Critical assumptions for capture-recapture method:
- Marking doesn't harm the animals or make them more visible to predators
- Animals mix evenly throughout the habitat
- Animals are restricted to the study area
- Marked animals have time to mix with the unmarked population
If these assumptions are not met, the population estimate will be inaccurate.
Specific investigation examples
Investigating pH effects on dandelion distribution
This investigation examines how soil pH influences where dandelions grow and how abundant they are in different areas.
Worked Example: pH and Dandelion Distribution Study
Method:
- Use random quadrat placement across the study area
- Measure soil pH in the centre of each quadrat
- Estimate the percentage cover of dandelions in each quadrat
- Calculate frequency of dandelions across all quadrats
- Analyse results for patterns between pH and dandelion abundance
Frequency calculation:
Percentage cover can be estimated visually (subjective) or calculated using grid quadrats (more accurate). Grid quadrats have a known number of intersection points, making calculations more precise.
Investigating light intensity effects on woodlice
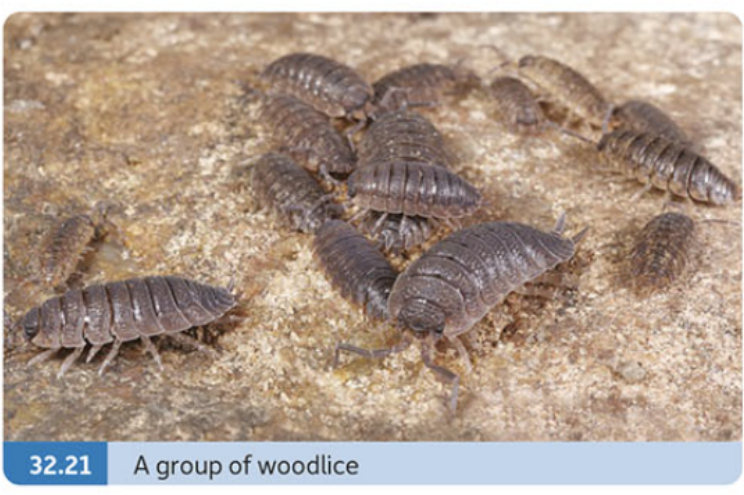
Woodlice are excellent organisms for studying how light intensity affects distribution because they show clear preferences for different light conditions.
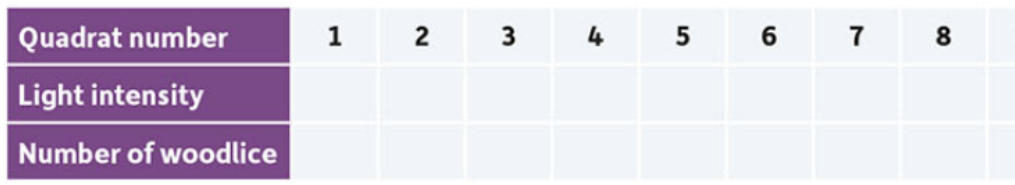
Worked Example: Light Intensity and Woodlice Distribution
Method:
- Place quadrats along a transect from hedge (shade) to open field (bright light)
- Measure light intensity using a light metre in each quadrat
- Count the number of woodlice in each quadrat
- Record results to identify patterns between light levels and woodlice abundance
This investigation can be adapted for different abiotic factors by changing the measurement equipment and study organism while keeping the same basic methodology.
Data analysis and interpretation
When analysing results, look for:
- Correlations between abiotic factor measurements and organism abundance
- Patterns in distribution along environmental gradients
- Optimal ranges where species are most abundant
- Limiting factors that restrict where species can survive
Remember that correlation doesn't prove causation - other unmeasured factors might also influence the results. Always consider multiple possible explanations for your observations.
Key Points to Remember:
-
Abiotic factors are measurable non-living environmental conditions that affect where organisms live and how many can survive in different areas
-
Quantitative investigations use systematic sampling methods like quadrats, transects, and capture-recapture to collect numerical data about species distribution and abundance
-
Frequency calculations help determine how commonly a species occurs across different environmental conditions using the formula:
-
Different sampling methods are needed for different organisms - quadrats for plants and slow-moving animals, capture-recapture for mobile animals
-
Proper analysis involves looking for patterns and correlations between abiotic factors and species abundance, while remembering that multiple factors usually influence distribution simultaneously