5a, 5b & 5c – To Investigate Factors that Affect the Rate of Photosynthesis (LC 2027) (Leaving Cert Biology): Revision Notes
📚Revision Notes
5a, 5b & 5c – To Investigate Factors that Affect the Rate of Photosynthesis
Introduction to photosynthesis investigations
Photosynthesis is a vital process that can be affected by several limiting factors. Understanding how these factors influence the rate of photosynthesis is crucial for biology students. The three main factors that control photosynthesis rate are light intensity, temperature, and carbon dioxide concentration.
These investigations use underwater aquatic plants to measure the rate of photosynthesis by counting oxygen bubbles produced. When plants photosynthesise underwater, they release oxygen gas which forms visible bubbles - making it easy to measure and compare photosynthesis rates.
Note
The bubble counting method provides a simple, direct way to observe photosynthesis in real-time. Each bubble represents oxygen gas produced during the light-dependent reactions of photosynthesis.
Controlling experimental variables
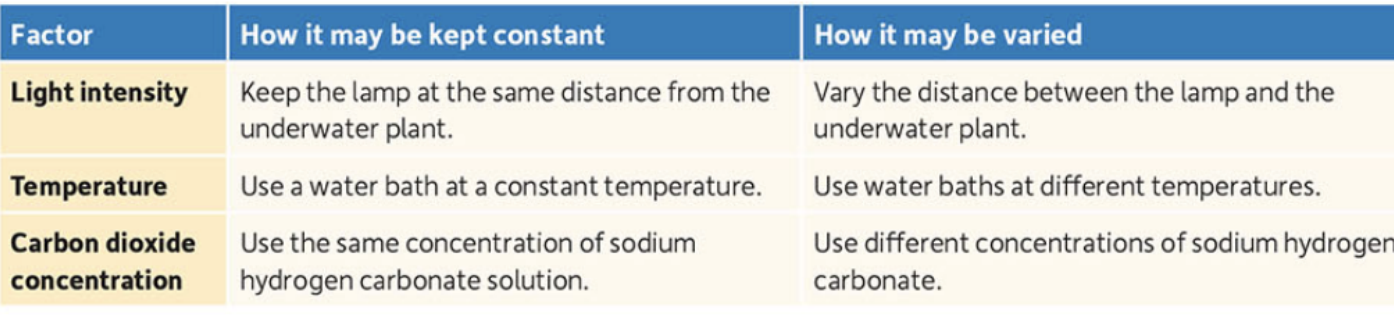
When investigating any one factor, the other variables must be kept constant to ensure a fair test. This table shows how each factor can be controlled or varied:
Important
The key to successful experiments is controlling variables properly. For each investigation, two factors remain constant whilst one is deliberately changed (the independent variable). This ensures that any changes observed in the results are due to the factor being tested, not other variables.
Investigation 5a: Effect of light intensity on photosynthesis rate
Experimental setup
This investigation examines how the distance between a light source and underwater plants affects the rate of photosynthesis.

Method
The experimental procedure involves several carefully controlled steps to ensure reliable results:
Example
Worked Example: Setting Up the Light Intensity Investigation
Step 1: Preparation Add excess sodium bicarbonate (sodium hydrogen carbonate) solution to water in a boiling tube. This ensures a constant supply of carbon dioxide throughout the experiment.
Step 2: Plant preparation Cut a section of underwater plant at an angle to ensure optimal flow of bubbles. Place the cut end facing upwards in the tube.
Step 3: Temperature control Place the experimental setup in a water bath at 25°C to maintain constant temperature conditions.
Step 4: Light intensity variation Position an adjustable lamp at different measured distances from the plant (typically 1cm to 25cm).
Step 5: Measurement Count the number of oxygen bubbles produced per minute at each distance. This provides a direct measure of photosynthesis rate.
Results and analysis
The relationship between light intensity and distance follows the inverse square law:
As the lamp moves further away from the plant:
- Light intensity decreases significantly
- Fewer oxygen bubbles are produced per minute
- The rate of photosynthesis decreases
When graphed, this creates a curved relationship showing that photosynthesis rate increases rapidly at first, then levels off at very high light intensities.
Note
The inverse square law means that when you double the distance from the light source, the light intensity becomes four times weaker. This explains why the rate of photosynthesis drops so dramatically as distance increases.
Investigation 5b: Effect of temperature on photosynthesis rate
Experimental setup and method
This investigation maintains constant light intensity and carbon dioxide levels whilst varying temperature:
- Setup consistency: Keep the lamp at a fixed distance (20cm) from the plant throughout the experiment.
- Temperature variation: Use water baths at different temperatures (typically 10°C, 20°C, 30°C, 40°C, and 50°C).
- Equilibration time: Allow the apparatus to adjust to each new temperature for 5 minutes before counting bubbles.
- Data collection: Count oxygen bubbles produced per minute at each temperature and calculate averages.
Results and analysis
The temperature investigation produces a characteristic bell-shaped curve:
- Low temperatures: Few bubbles produced as enzyme activity is low
- Optimal temperature: Maximum bubble production around 25-35°C
- High temperatures: Rapid decrease in bubble production as enzymes become denatured
Note
This pattern occurs because photosynthesis involves enzyme-controlled reactions. As temperature increases, enzyme activity increases up to an optimal point. Beyond this temperature, enzymes begin to denature and lose their function, causing photosynthesis rates to plummet.
Investigation 5c: Effect of carbon dioxide concentration on photosynthesis rate
Experimental approach
This investigation examines how varying carbon dioxide levels affect photosynthesis whilst keeping light and temperature constant:
- Constant conditions: Maintain temperature at 25°C using a water bath and keep the lamp at 20cm distance throughout.
- Carbon dioxide variation: Use sodium hydrogen carbonate solutions of different concentrations to provide varying levels of dissolved CO₂.
- Measurement consistency: Follow the same bubble-counting procedure as previous investigations.
Expected results
The carbon dioxide investigation typically shows:
- Low CO₂ concentrations: Limited bubble production as carbon dioxide becomes the limiting factor
- Increasing CO₂: Steady increase in photosynthesis rate
- Saturated CO₂: Rate levels off when carbon dioxide is no longer limiting
Note
At very high CO₂ concentrations, another factor (usually light intensity or temperature) becomes the limiting factor instead. This demonstrates the concept of limiting factors in biological processes.
Key experimental considerations
Accuracy improvements
Important
Several techniques can improve the reliability of these experiments:
- Multiple readings: Repeat each measurement three times and calculate averages
- Alternative measurement: Collect oxygen gas in an inverted test tube to measure volume rather than counting bubbles
- Longer observation periods: Count bubbles over several minutes for more accurate rates
- Standardised conditions: Ensure consistent plant material and cutting techniques
Safety considerations
Note
Important Safety Points:
- Handle glass apparatus carefully
- Ensure electrical equipment (lamps) are positioned safely away from water
- Be cautious with hot water baths to avoid burns
Sources of error
Common experimental errors that can affect results include:
- Inconsistent bubble counting
- Temperature fluctuations
- Changes in plant condition during extended experiments
- Variations in plant cutting quality
Summary
Key Points to Remember:
-
Three main factors affect photosynthesis rate: light intensity, temperature, and carbon dioxide concentration
-
Light intensity follows the inverse square law - as distance doubles, light intensity decreases by a factor of four
-
Temperature shows an optimum curve because photosynthesis involves enzyme-controlled reactions that denature at high temperatures
-
Bubble counting provides a simple, direct method to measure oxygen production and therefore photosynthesis rate
-
Controlled variables are essential - only change one factor at a time whilst keeping others constant for valid results