13.1 – Investigating Alcohol as a Thermometer Liquid (Leaving Cert Physics): Revision Notes
13.1 – Investigating Alcohol as a Thermometer Liquid
Introduction to the experiment
This experiment investigates whether alcohol in glass can be effectively used as a thermometer liquid. The main goal is to analyse the suitability of alcohol by examining how the length of an alcohol column changes with temperature. You'll compare an ungraduated alcohol thermometer with a standard laboratory thermometer to understand the thermometric properties of alcohol.
The experiment involves measuring the alcohol column length at different temperatures and creating a calibration graph. This helps determine whether alcohol expands consistently with temperature changes, making it suitable for temperature measurement.
A thermometric property is any physical property that changes measurably and predictably with temperature. For alcohol thermometers, this property is the expansion of the alcohol column length.
Equipment required
For this investigation, you'll need several key pieces of apparatus:
- Ungraduated alcohol-in-glass thermometer - this contains alcohol but has no temperature scale marked on it
- Standard laboratory thermometer - used as a reference for accurate temperature readings
- Ice - to create low temperatures for measurement
- 250 ml beaker - to hold water at different temperatures
- Retort stand and clamp - to secure the thermometers in position
- Bunsen burner - for heating the water
- Tripod and gauze - to support the beaker during heating
The key to this experiment is having both an ungraduated thermometer (to test) and a standard calibrated thermometer (as reference). Without the standard thermometer, you cannot establish the temperature-length relationship needed for calibration.
Experimental method
The procedure involves several careful steps to ensure accurate measurements:
Initial setup: Begin by placing both the ungraduated alcohol thermometer and the standard thermometer in a beaker of melting ice. Leave them until the alcohol column stops changing and reaches a steady reading. This gives you the lowest temperature measurement point.
Recording measurements: Read and record the temperature shown on the standard thermometer. Simultaneously, mark the position of the alcohol column on the glass tube and measure the length of this column. Record both values carefully.
Temperature variations: Remove the alcohol thermometer from the ice and set up your heating apparatus using the Bunsen burner, tripod, gauze and beaker filled with water heated to about 10°C.
Systematic heating: Gradually heat the water in increments of approximately 10°C each time. At each temperature point, read the standard thermometer and measure the corresponding length of the alcohol column. Repeat this process at least six times to gather sufficient data.
Graph construction: Plot a graph showing the relationship between alcohol column length (vertical axis) and temperature (horizontal axis). This graph reveals the thermometric property of alcohol.
Why start with ice? Starting with the lowest possible temperature (0°C with melting ice) gives you a reliable baseline measurement and allows you to observe the full range of alcohol expansion as temperature increases.
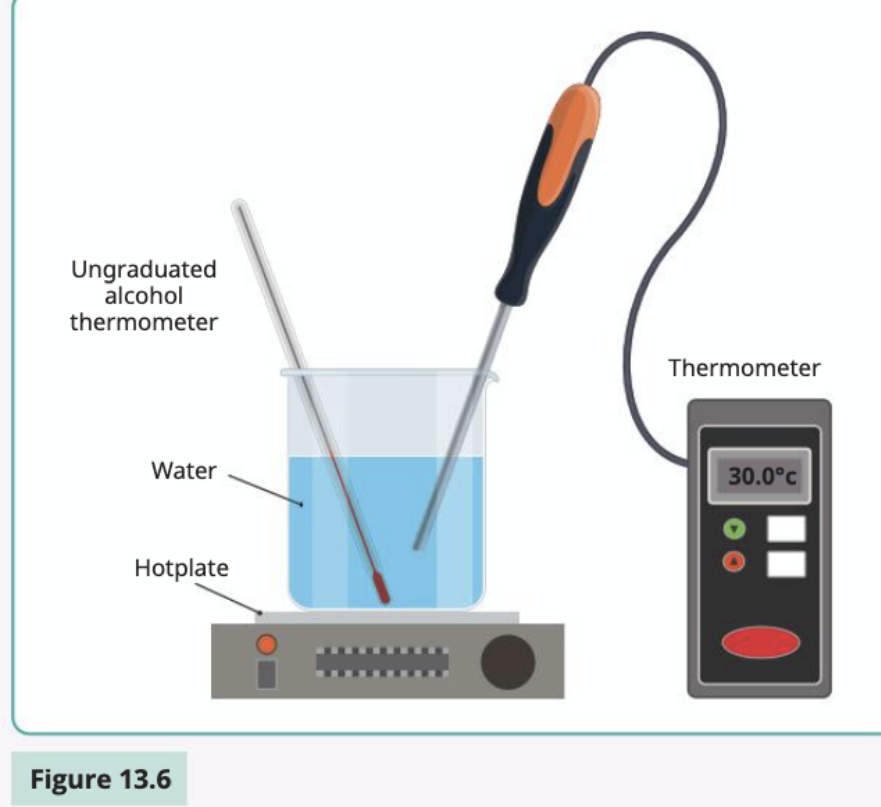
Understanding the experimental setup
The diagram shows the complete apparatus arrangement. The ungraduated alcohol thermometer (thin glass tube with red alcohol) and digital thermometer are both immersed in water. The water sits in a beaker on a hotplate, which provides controlled heating. This setup allows you to compare the alcohol expansion with known temperatures.
Analysis of results
When analysing your experimental data, consider these important aspects:
Measuring accuracy: Examine whether you could measure the alcohol column length accurately and if the standard thermometer provided reliable readings. Consider factors that might affect measurement precision.
Linear relationship: Determine if the alcohol column length varies continuously and predictably with temperature. A good thermometer liquid should show consistent expansion.
Sensitivity: From your graph, estimate how sensitive the alcohol thermometer is by calculating the length increase per degree temperature rise. Higher sensitivity means more precise temperature detection.
Worked Example: Calculating Thermometer Sensitivity
If your alcohol column increases from 50mm at 0°C to 80mm at 60°C:
Step 1: Find the total length change Length change = 80mm - 50mm = 30mm
Step 2: Find the temperature range Temperature range = 60°C - 0°C = 60°C
Step 3: Calculate sensitivity Sensitivity = Length change ÷ Temperature range Sensitivity = 30mm ÷ 60°C = 0.5mm/°C
This means the alcohol column increases by 0.5mm for every 1°C temperature rise.
Practical suitability: Evaluate whether alcohol demonstrates the necessary properties for thermometer use, including linear expansion, adequate sensitivity, and measurable changes.
Key considerations for thermometer liquids
Calibration process: Any thermometer requires calibration against known temperature standards. Your graph essentially creates a calibration curve that converts alcohol column lengths into temperature readings.
Alternative applications: Understanding how this method works helps you appreciate how other types of thermometers (like thermocouples or resistance thermometers) can be calibrated using similar principles.
Critical Calibration Concept: An ungraduated thermometer is useless without calibration. The calibration graph you create is what transforms meaningless column lengths into meaningful temperature measurements. This is why systematic measurement at known temperatures is essential.
Measurement limitations: Consider practical factors such as the range of temperatures alcohol can measure, its visibility in the glass tube, and how external conditions might affect readings.
Key Points to Remember:
- Alcohol expands linearly with temperature, making it potentially suitable as a thermometer liquid
- Calibration is essential - you must create a reference graph to convert column lengths to actual temperatures
- Systematic measurement at regular temperature intervals provides the most reliable calibration data
- Sensitivity matters - the greater the length change per degree, the more precise your temperature readings will be
- Always compare with a standard thermometer to ensure your measurements are accurate and meaningful