Investigating the Rate of Enzyme-Catalysed Reactions (VCE SSCE Biology): Revision Notes
Investigating the Rate of Enzyme-Catalysed Reactions
Introduction to catalase
Oxygen is essential for survival, but it can also be harmful. When oxygen forms a 'superoxide', it can damage molecules in cells and speed up the ageing process. All cells contain an enzyme called superoxide dismutase that converts superoxides into hydrogen peroxide (H₂O₂). However, hydrogen peroxide can break down into hydroxyl radicals, which can damage DNA and proteins.
Catalase is the enzyme that solves this problem by converting hydrogen peroxide into harmless oxygen and water:
This chemical equation shows how catalase breaks down hydrogen peroxide into water and oxygen gas.
Hydrogen peroxide (H₂O₂) is produced naturally in cells as a byproduct of metabolism, but it's toxic in high concentrations. Catalase works incredibly fast - it's one of the most efficient enzymes known, capable of converting millions of hydrogen peroxide molecules per second!
Understanding enzymes
Enzymes are biological catalysts that speed up chemical reactions without being used up or changed in the process. They work through a specific mechanism:
- Binding: The enzyme binds with substrate molecules at a specific region called the active site
- Lowering activation energy: The enzyme reduces the energy needed for the reaction to occur
- Release: After the reaction, the enzyme releases the products and remains unchanged
The Lock and Key Mechanism
Enzymes are highly specific - each enzyme only catalyses one particular reaction. This is because the active site has a unique three-dimensional shape that perfectly matches its substrate, much like a lock and key. This specificity is crucial for controlling cellular reactions.
Factors affecting enzyme activity
Several factors can influence how efficiently enzymes work:
- Temperature - affects the kinetic energy of molecules and enzyme shape
- pH - changes in acidity or alkalinity can alter enzyme structure
- Substrate concentration - the amount of substrate available for the enzyme
- Enzyme concentration - the amount of enzyme available to catalyse reactions
- Chemical inhibitors - substances that reduce enzyme activity
Investigation overview
This controlled experiment investigates how substrate concentration affects the rate of the catalase reaction. The enzyme catalase is found in potatoes and many other living tissues.
Part 1 examines the effect of different hydrogen peroxide concentrations on the reaction rate. Part 2 allows you to design your own experiment to investigate another factor affecting enzyme activity.
This investigation uses a practical approach to understand enzyme kinetics. By measuring the volume of oxygen gas produced, we can directly observe how changing substrate concentration affects the speed of the catalase-catalysed reaction.
Aim
To measure the rate of an enzyme-catalysed reaction at different substrate concentrations.
Materials required
- 3 × 20 mL fresh puréed potato (source of catalase enzyme)
- 2 mL distilled water (0% concentration control)
- 2 mL 1% hydrogen peroxide solution
- 2 mL 3% hydrogen peroxide solution
- 2 mL 5% hydrogen peroxide solution
- 1 × 125 mL conical flask
- 1 × 50 mL measuring cylinder
- Clamp stand, boss, and clamp (optional - for securing measuring cylinder)
- 1 × stopwatch
- 1 × 1-holed rubber stopper that fits the 125 mL conical flask
- 30–50 cm rubber tubing to fit the rubber stopper hole
- 1 × ice cream container or deep dish
Method
Part 1: Investigating substrate concentration
Step 1: Prepare the enzyme
Pour 20 mL of puréed potato into the conical flask. Use a stirring rod if needed to ensure all the potato sits on the base of the flask. The potato contains the catalase enzyme.
Step 2: Set up the tubing
Insert the rubber tubing into the rubber stopper and ensure the fit is airtight. This prevents gas from escaping during the experiment.
Critical Technique: Achieving an Airtight Seal
An airtight seal is essential for accurate results. Test your seal by gently pulling on the tubing - it should not come loose. Any gas leakage will result in underestimating the reaction rate. If your seal isn't perfect, try wrapping the connection with parafilm or laboratory tape.
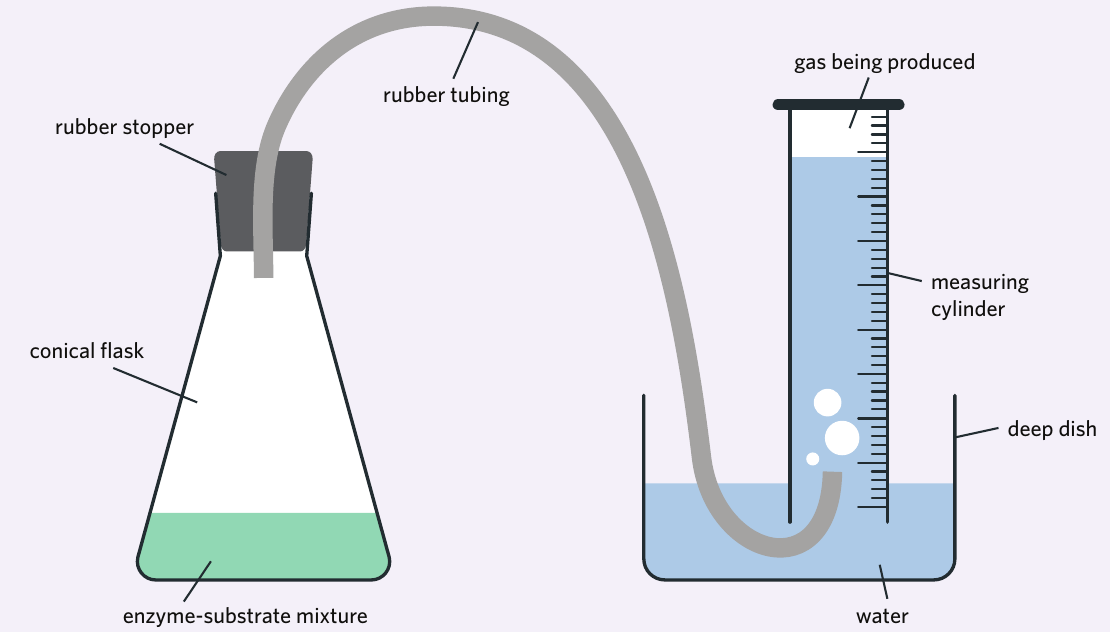
Step 3: Prepare the gas collection system
Fill the ice cream container about half full with tap water. Fill the measuring cylinder completely to the top with water. Place your hand firmly over the top of the measuring cylinder to prevent water from escaping, then turn it upside down. Put the mouth of the measuring cylinder underneath the water in the ice cream container (while still covering it with your hand), then remove your hand. The measuring cylinder should remain full of water with no air at the top.
Step 4: Secure the measuring cylinder
You can secure the measuring cylinder using a clamp stand, boss, and clamp, or have one person hold it throughout the experiment. Ensure the measuring cylinder is neither sitting on the bottom of the ice cream container nor rising above the water surface.
Step 5: Position the tubing
Place the free end of the rubber tubing (not secured to the stopper) underneath the water in the ice cream container and up into the measuring cylinder. While doing this, ensure the measuring cylinder stays underwater and doesn't collect air bubbles.
Tip for Step 5: Work slowly and carefully when positioning the tubing. Any air bubbles trapped during setup will affect your measurements. If you notice bubbles, start the gas collection setup again from Step 3.
Step 6: Start the reaction
This step must be done quickly and carefully - you may wish to practise first. Pour 2 mL of 1% hydrogen peroxide solution into the conical flask containing the potato. Quickly place the rubber stopper (connected to the rubber tubing) on top of the conical flask to seal it. At the same time, have a second person start the stopwatch.
Timing is Critical!
The first few seconds of the reaction are when the most gas is produced. Practice the sealing motion several times before adding the hydrogen peroxide. Having a partner to start the stopwatch simultaneously will improve the accuracy of your time measurements.
Step 7: Measure gas production
After 30 seconds, measure the volume of gas in the measuring cylinder. Record this measurement in your results table.
Step 8: Repeat with different concentrations
Empty and rinse the conical flask thoroughly. Repeat steps 1–7 with the other concentrations of hydrogen peroxide (3% and 5%) and the distilled water (0% control).
Part 2: Student-directed investigation
Step 9: Improve the method
Identify changes to the Part 1 method that would improve the accuracy and precision of the data. Consider ways to minimise personal errors, random errors, and systematic errors.
Step 10: Design your own investigation
Choose a new research question about how different factors might affect the rate of the enzyme-catalysed reaction. Design and carry out an experiment to answer this question. When writing your method, ensure you address:
- Independent variable: What factor are you changing?
- Dependent variable: What are you measuring?
- Control groups: What serves as your baseline for comparison?
- Experimental groups: What conditions are you testing?
- Controlled variables: What factors must remain constant?
- Error minimisation: How will you reduce errors in data collection?
- Replication: To what extent will you repeat your measurements?
Investigation Ideas for Part 2:
- Effect of temperature on enzyme activity (use water baths at different temperatures)
- Effect of pH on enzyme activity (use buffer solutions)
- Effect of enzyme concentration (use different amounts of potato purée)
- Effect of inhibitors (add substances that might slow the reaction)
Results
Part 1 data collection
Record your measurements in a table:
| The concentration of hydrogen peroxide (%) | Amount of gas produced (mL) |
|---|---|
| 0 (distilled water) | |
| 1 | |
| 3 | |
| 5 |
After completing your measurements, create a graph to display your results. Plot hydrogen peroxide concentration on the x-axis and the amount of gas produced on the y-axis.
Graphing Tips:
- Use a line graph to show the relationship between concentration and reaction rate
- Include a title, axis labels with units, and a suitable scale
- Consider whether your data points should be connected with a smooth curve or straight lines
- The 0% control should show little to no gas production
Part 2 results
Record your Part 2 results and present them in the most appropriate format for your investigation. This might include tables, graphs, or diagrams depending on what you measured.
Discussion questions
Understanding your results requires careful consideration of several aspects:
1. Enzyme structure
Enzymes are proteins with a specific three-dimensional shape that includes an active site where substrates bind. This precise shape is maintained by weak bonds (hydrogen bonds and ionic bonds) between different parts of the protein molecule.
2. How enzymes work
Enzymes catalyse reactions by binding to substrates at their active site, which lowers the activation energy needed for the reaction to proceed. This allows the reaction to happen faster. Think of activation energy as a hill that reactants must climb - enzymes reduce the height of this hill.
3. Importance of catalase
Catalase is vital for living organisms because it breaks down hydrogen peroxide, which is toxic to cells, into harmless water and oxygen. Without catalase, hydrogen peroxide would accumulate and damage cellular components including DNA, proteins, and lipids. This is why catalase is found in nearly all living organisms exposed to oxygen.
4. Gas produced: The gas collected in the measuring cylinder is oxygen (O₂), which is produced when catalase breaks down hydrogen peroxide according to the equation:
Worked Example: Analyzing Your Results
Interpreting substrate concentration effects:
If you obtained these results:
- 0% H₂O₂: 0 mL of gas
- 1% H₂O₂: 5 mL of gas
- 3% H₂O₂: 12 mL of gas
- 5% H₂O₂: 15 mL of gas
Analysis: The data shows that as substrate concentration increases, more gas is produced in the same time period. This demonstrates that higher substrate concentration increases the reaction rate. However, notice that the increase from 3% to 5% (3 mL) is less than the increase from 1% to 3% (7 mL). This suggests the enzyme is approaching saturation - there are fewer free enzyme active sites available for the additional substrate molecules.
5. Analyzing your results: Your results from Part 1 should show how different substrate concentrations affect the rate of the enzyme-catalysed reaction. Generally, as substrate concentration increases, the reaction rate increases (more gas is produced) until the enzyme becomes saturated.
6. Controlled variables: Variables that must remain constant throughout the experiment include:
- Temperature of the reaction
- Volume of enzyme (puréed potato)
- Time allowed for the reaction (30 seconds)
- pH of the solution
- Apparatus used
Why Control Variables Matter
If any of these variables change between trials, you cannot be certain whether differences in gas production are due to substrate concentration (your independent variable) or another factor. For example, if one trial was warmer than another, increased enzyme activity from heat could mask or exaggerate the effect of substrate concentration.
7. Sources of error: Common errors in this experiment include:
- Gas escaping before the stopper is sealed properly (personal error)
- Temperature variations affecting enzyme activity (systematic error)
- Difficulty reading the gas volume accurately (random error)
- Air bubbles trapped in the measuring cylinder during setup (systematic error)
Improving the experiment
To overcome limitations:
- Practice the sealing technique to minimise gas loss
- Use a water bath to maintain constant temperature
- Take multiple measurements and calculate an average
- Use a more precise gas collection method
- Conduct the experiment at different time intervals (e.g., 15, 30, 45, 60 seconds) to get a better picture of the reaction rate
Advanced Improvement: Calculating Reaction Rate
Instead of just measuring gas volume at one time point, you could measure the volume every 10 seconds for 2 minutes. This would allow you to calculate the initial rate of reaction (the slope of the graph at the start) which gives a more accurate measure of enzyme activity. Initial rates are preferred because substrate concentration doesn't change much in the first moments of the reaction.
Writing your conclusion
A comprehensive conclusion should include:
- Hypothesis evaluation: State whether your results supported your hypothesis, referencing specific data
- Limitations: Identify weaknesses in the experimental design or execution
- Improvements: Suggest specific ways to improve the accuracy and reliability of the investigation
- Broader implications: Discuss how your findings relate to enzyme function in living organisms or suggest further areas of investigation
Worked Example: Writing a Strong Conclusion
"The investigation supported the hypothesis that increasing substrate concentration increases the rate of enzyme-catalysed reactions. As hydrogen peroxide concentration increased from 1% to 5%, the volume of oxygen gas produced in 30 seconds increased from 5 mL to 15 mL, demonstrating a positive correlation between substrate availability and reaction rate.
However, the experiment had limitations. Temperature was not precisely controlled, which could have introduced systematic error as enzyme activity is temperature-dependent. Additionally, the 30-second time point may not have been optimal for observing the full range of enzyme activity.
To improve this investigation, I would use a water bath to maintain constant temperature at 25°C and take measurements at multiple time intervals (10, 20, 30, 40, 50, 60 seconds) to calculate initial reaction rates. I would also perform three replicates of each concentration to calculate mean values and identify any anomalous results.
These findings have real-world significance: they demonstrate why cells need adequate amounts of catalase to handle varying levels of hydrogen peroxide produced during metabolism. Understanding enzyme kinetics helps explain how cells regulate potentially harmful reactions."
Remember!
Key Points to Remember:
- Catalase is crucial: This enzyme protects cells by converting toxic hydrogen peroxide into harmless water and oxygen
- Substrate concentration matters: Increasing substrate concentration generally increases the reaction rate until the enzyme becomes saturated
- Controlled variables are essential: Temperature, pH, enzyme concentration, and time must remain constant for valid results
- Gas collection measures reaction rate: The volume of oxygen gas produced indicates how fast the enzyme-catalysed reaction is occurring
- Careful technique is critical: Ensuring an airtight seal and preventing gas escape is essential for accurate measurements
- Enzyme saturation is real: At very high substrate concentrations, all enzyme active sites are occupied, and adding more substrate won't increase the rate further
- Replication improves reliability: Repeating measurements and calculating averages helps identify true patterns and reduces the impact of random errors