Photosynthesis in Algae (v2) (VCE SSCE Biology): Revision Notes
Photosynthesis in Algae (v2)
Introduction to the investigation
This investigation is a controlled experiment that explores how algal density affects the rate of photosynthesis. It demonstrates a practical method for measuring photosynthesis rates using pH changes.
What are algae?
Algae are simple organisms (a type of protist) that live in aquatic environments and can carry out photosynthesis, just like plants. They use sunlight, water, and carbon dioxide to produce glucose and oxygen.
How do we measure photosynthesis in algae?
Scientists measure photosynthesis rates in algae by tracking changes in carbon dioxide (CO₂) levels in their environment. This works because CO₂ is a key input for photosynthesis - as algae photosynthesize more actively, they consume more CO₂ from their surroundings.
When CO₂ levels decrease in the water surrounding algae, we know photosynthesis rates have increased. This inverse relationship is the foundation of this experimental method.
Using a pH indicator
In this experiment, we use a pH indicator called hydrogen carbonate indicator to make CO₂ changes visible. This indicator changes colour as pH changes, which allows us to observe what's happening without complex measuring equipment.
The Key Relationship:
When algae photosynthesize, they remove CO₂ from the water → Less CO₂ in the water causes the pH to increase → The pH indicator changes colour when pH increases
Therefore: colour change → pH increase → CO₂ decrease → photosynthesis is occurring
Understanding this chain of events is essential for interpreting your experimental results.
Aim
To determine whether algal density affects the rate of photosynthesis.
In other words, this experiment tests whether having more algae in the same volume of water leads to faster photosynthesis.
Materials
- 100 algal balls
- 5 empty 7 mL vials (small bottles)
- 10 mL of hydrogen carbonate indicator
- 1 pH colour chart
- 2 mL of distilled water
- 2 plastic pipettes (2 mL capacity)
- Light source
- 1 strainer
- 1 spoon
- 1 tape measure
Method
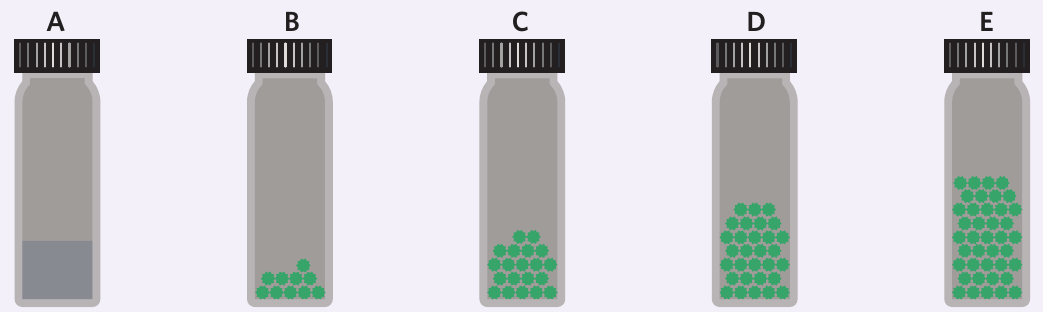
Step 1: Label the vials
Label your five vials with the letters A, B, C, D, and E.
Step 2: Prepare the control
Using a pipette, add 2 mL of distilled water into vial A. This vial contains no algae and serves as your control.
Step 3: Add algal balls
Add different numbers of algal balls to each vial:
- Vial A: 0 algal balls (water only - control)
- Vial B: 10 algal balls
- Vial C: 20 algal balls
- Vial D: 30 algal balls
- Vial E: 40 algal balls
Using the strainer can make it easier to count and distribute the algal balls accurately. Take your time with this step to ensure precise counts - accuracy here is crucial for reliable results.
Step 4: Add the pH indicator
Using your pipette, add 2 mL of hydrogen carbonate indicator to all five vials. Then secure the lids firmly on each vial.
Step 5: Record initial readings
Before exposing the vials to any light, use the pH colour chart to estimate the pH of the solution in each vial. Record both the colour and the pH value in your results table.
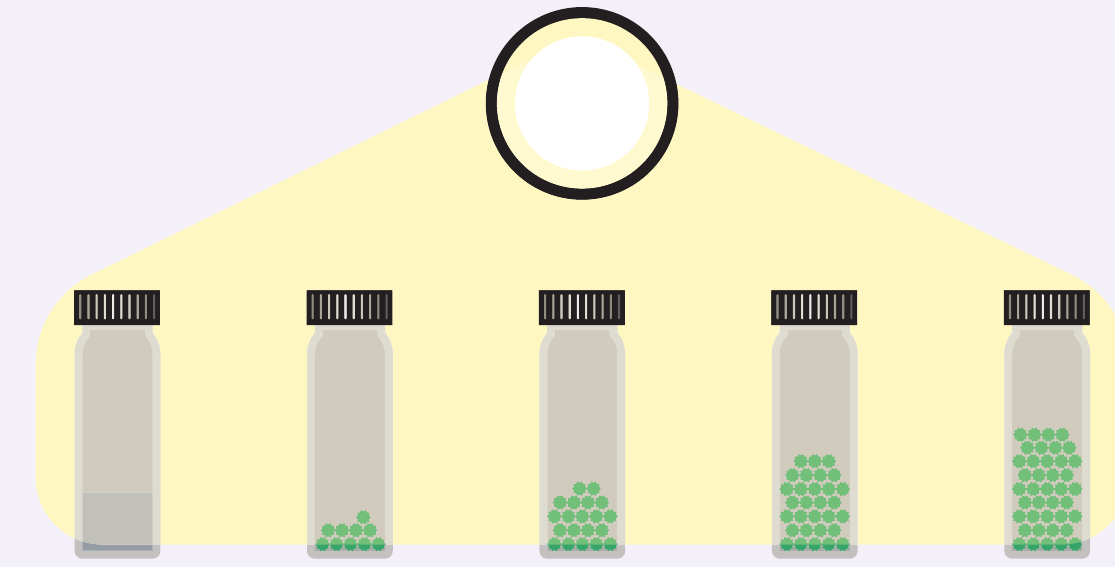
Step 6: Expose to light and record observations
Place all five vials at an equal distance from your light source. Use the tape measure to ensure each vial is the same distance away.
Record the colour and pH of each solution at the following time points:
- After 10 minutes of light exposure
- After 20 minutes of light exposure
- After 30 minutes of light exposure
Results
Create and complete the following table in your notebook:
| Vial | Prior to light exposure | 10 minutes after light exposure | 20 minutes after light exposure | 30 minutes after light exposure |
|---|---|---|---|---|
| A | ||||
| B | ||||
| C | ||||
| D | ||||
| E |
For each cell in the table, record both the colour of the solution and its estimated pH value. Be as specific as possible with colour descriptions (e.g., "yellow-orange" rather than just "yellow").
Understanding the experimental design
Independent variable
The independent variable is the factor you deliberately change - in this case, the algal density (number of algal balls in each vial).
Dependent variable
The dependent variable is what you measure to see the effect of your changes - in this case, the pH of the solution (which indicates the rate of photosynthesis).
Controlled variables
These are factors kept constant to ensure a fair test:
- Volume of hydrogen carbonate indicator (2 mL in each vial)
- Distance from light source (equal for all vials)
- Light intensity (same source for all vials)
- Time of exposure (all measured at same intervals)
- Temperature (room temperature, same for all vials)
Why use equal distance from the light source?
Placing each vial at the same distance from the light source is crucial because light intensity affects photosynthesis rate.
If vials were at different distances, we couldn't be sure whether differences in pH were due to algal density or light intensity. This would make the experiment unfair and the results unreliable.
This is why controlling variables is essential in any scientific investigation!
Understanding photosynthesis
The photosynthesis process
Photosynthesis occurs in two main stages:
Light-dependent stage:
- Location: Thylakoid membranes in chloroplasts
- Inputs: Light energy, water
- Outputs: Oxygen, ATP, NADPH
- Process: Light energy is captured and converted into chemical energy
Light-independent stage (Calvin cycle):
- Location: Stroma of chloroplasts
- Inputs: Carbon dioxide, ATP, NADPH
- Outputs: Glucose (and other organic molecules)
- Process: CO₂ is fixed and converted into glucose using the energy from the light-dependent stage
The two stages are interdependent - the light-dependent stage produces ATP and NADPH which are then used in the light-independent stage to fix CO₂ into glucose. This is why this experiment focuses on CO₂ consumption as an indicator of overall photosynthesis rate.
Functions of glucose in plant cells
The glucose produced during photosynthesis has several important uses:
- Energy source: Broken down during cellular respiration to release energy (ATP)
- Storage: Converted to starch for long-term energy storage
- Building material: Used to make cellulose for cell walls
- Biosynthesis: Converted into other organic molecules like proteins and lipids
Interpreting the results
Expected trends
Expected Experimental Outcomes:
If algal density does affect photosynthesis rate, you should observe:
Control (Vial A): Little to no change in pH, as there are no algae to photosynthesize - this provides your baseline.
Increasing trend: Vials with more algal balls (B→C→D→E) should show greater pH increases:
- Vial B (10 algal balls): Small pH increase
- Vial C (20 algal balls): Moderate pH increase
- Vial D (30 algal balls): Large pH increase
- Vial E (40 algal balls): Largest pH increase
Time effect: pH should increase over time in vials containing algae as photosynthesis continues throughout the 30-minute period.
The vial with the most algae (Vial E with 40 balls) should show the greatest pH increase, indicating the highest rate of photosynthesis.
What the colour changes mean
When you observe the hydrogen carbonate indicator changing colour towards a higher pH (more alkaline):
- This indicates CO₂ is being removed from the solution
- The algae are actively photosynthesizing
- The rate of colour change indicates the rate of photosynthesis
The more dramatic the colour change, the more CO₂ has been consumed, and therefore the faster the rate of photosynthesis. This is why vials with more algae should show more pronounced colour changes.
Improving the experiment
To increase the accuracy and precision of this experiment, you could:
- Multiple trials: Repeat the experiment several times and calculate average results
- More frequent measurements: Record observations every 5 minutes instead of every 10 minutes
- Standardize algal balls: Ensure all algal balls are similar in size
- Temperature control: Use a water bath to maintain constant temperature
- Light intensity measurement: Use a light meter to confirm equal light intensity at each vial position
- Larger sample size: Use more than 5 vials to get more data points
- Quantitative pH measurement: Use a pH probe for more precise pH readings than the colour chart
Why improvements matter:
Scientific experiments should be reproducible and reliable. The improvements listed above reduce experimental error and increase confidence in your results. In exam questions, you may be asked to evaluate an experimental method and suggest improvements - understanding these principles will help you answer such questions effectively.
Exam tips
- Remember the relationship: Increased photosynthesis → decreased CO₂ → increased pH
- Identify variables clearly: Know which is independent, dependent, and controlled
- Explain the control: Vial A (water only) shows what happens without algae, providing a baseline for comparison
- Link to theory: Connect your observations to the photosynthesis process - algae using CO₂ as an input
- Discuss limitations: In exam questions, be prepared to suggest improvements to experimental design
Remember!
Key Points to Remember:
-
Algae are photosynthetic protists that use CO₂ as an input for photosynthesis, making them useful for studying photosynthesis rates.
-
pH indicators make CO₂ changes visible - when algae photosynthesize and use up CO₂, the pH increases and the indicator changes colour.
-
The experimental setup tests how algal density affects photosynthesis by comparing vials with different numbers of algal balls (0, 10, 20, 30, 40) all exposed to the same conditions.
-
Controlled variables are essential - keeping distance from light, volume of indicator, and exposure time constant ensures the experiment is fair and only tests the effect of algal density.
-
Greater algal density should lead to faster photosynthesis - more algae means more CO₂ consumption, resulting in greater pH increases over the same time period.
-
The relationship chain: More photosynthesis → More CO₂ used → pH increases → Indicator changes colour