Using Genomic Databases (VCE SSCE Biology): Revision Notes
Using Genomic Databases
What is a genome?
A genome represents the complete DNA blueprint of an organism. More specifically, it is the full set of DNA contained within the haploid chromosomes found in gametes (sex cells). This genetic information includes all the genes necessary to build and maintain a complex living organism.
In eukaryotic organisms, each cell with a nucleus contains a copy of the organism's complete genome. The genome acts as an instruction manual, providing all the genetic information needed for life.
Think of the genome as the master recipe book for an organism - it contains all the instructions needed to build every protein, regulate every process, and maintain all the characteristics that make each species unique.
Genome size varies between species
Different organisms have genomes of vastly different sizes, measured in base pairs (bp):
- Human genome: Over 3 billion base pairs in length
- Fruit fly (Drosophila melanogaster): Approximately 165 million base pairs
Common Misconception:
Genome size alone doesn't determine an organism's complexity. Other factors, such as gene number, gene regulation, and non-coding DNA regions, also play crucial roles in determining how complex an organism is.
Comparing genomes across species
Comparative genomics allows scientists to examine similarities and differences between the genomes of different organisms. This field of study helps us understand:
- Evolutionary relationships between species
- How genes have changed over time
- Which genetic sequences are conserved (stayed the same) across evolution
- The function of specific genes
A key principle is that the greater the genomic differences between two organisms, the less closely related they are likely to be. Conversely, organisms with very similar genomes typically share a more recent common ancestor.
The degree of genomic similarity acts as a molecular clock - the more similar two genomes are, the more recently they shared a common ancestor. This principle forms the foundation of modern evolutionary biology and helps scientists construct phylogenetic trees showing relationships between species.
The Human Genome Project
The Human Genome Project (HGP) was a landmark scientific achievement that mapped the entire human genome. This project generated enormous amounts of genetic data, which is now stored in publicly accessible databases.
Thanks to the HGP, researchers can now:
- Access extensive genomic databases
- Compare human genes with those of other species
- Model genetic similarities at high resolution
- Investigate the function of specific genes
The Human Genome Project, completed in 2003, was one of the most ambitious scientific undertakings in history. The data it generated continues to drive medical discoveries, evolutionary research, and our understanding of what makes us human.
Modelling in comparative genomics
Modelling is an important scientific methodology used in comparative genomics. Rather than conducting physical experiments, scientists use computational models and software programs to:
- Analyze genomic sequences across different organisms
- Compare gene sequences between species
- Visualize genomic similarities and differences
- Identify conserved regions of DNA
Why use computational modelling?
This approach is particularly useful because it allows researchers to examine millions of base pairs quickly and accurately without needing laboratory equipment. What might take months in a traditional laboratory can be accomplished in minutes using genomic databases and computational tools.
The TYR gene investigation
Purpose of the investigation
This practical investigation demonstrates how genomic databases can be used to compare a specific gene across multiple species. The gene studied is called TYR, which codes for the enzyme tyrosinase. By comparing the TYR gene in humans with the same gene in mice, chimpanzees, and cows, we can observe how similar or different these sequences are.
Materials required
- Computer with internet access
- Web browser
- Access to the VISTA genome browser (website: pipeline.lbl.gov/cgi-bin/gateway2)
Understanding the TYR gene location
The TYR gene in humans is located on chromosome 11, specifically between base pairs 89,177,565 and 89,295,759. This precise molecular address allows researchers to find and compare the exact same genetic region across different species.
Using the VISTA genome browser
Worked Example: Comparing the TYR Gene Across Species
This step-by-step procedure demonstrates how to use the VISTA genome browser to perform comparative genomics analysis.
Step 1: Accessing the database
First, navigate to the VISTA genome browser website. This free online tool provides powerful comparative genomics capabilities.
Step 2: Entering the gene location
Enter the chromosomal coordinates for the human TYR gene: chr11: 89,177,565 – 89,295,759
This tells the program exactly which section of the human genome you want to examine.
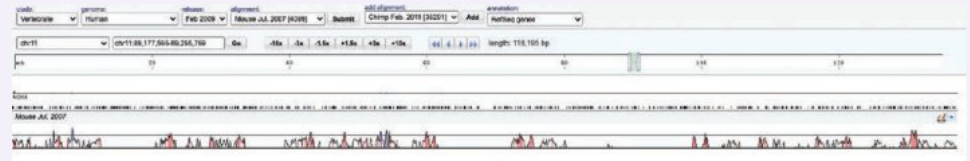
Step 3: Viewing the initial alignment
After submitting your coordinates, the browser displays a genomic alignment between the human TYR gene and the corresponding sequence in the mouse genome. This visualization shows where the sequences match and where they differ.
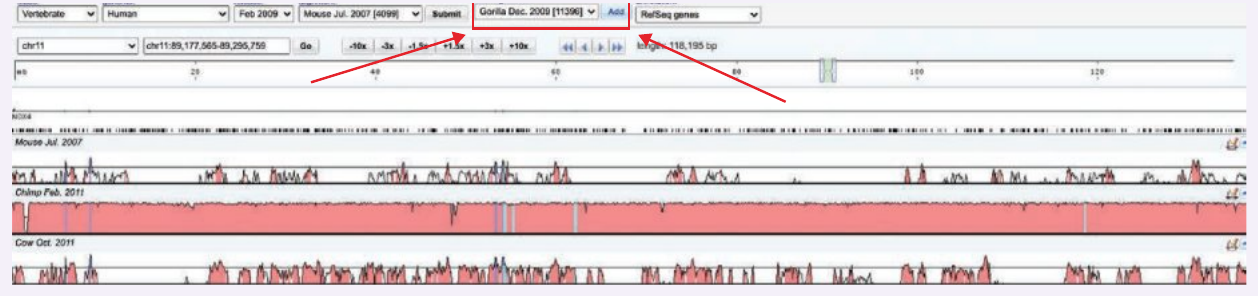
Step 4: Adding more species for comparison
To create a more comprehensive comparison, you can add additional species to your analysis. For this investigation, add both chimpanzee and cow genomes to the comparison. This creates a multi-species alignment that reveals evolutionary relationships.
Analyzing the results
Once you've completed your VISTA browser comparison, you'll need to interpret the data presented. The browser provides both visual and numerical information about genomic similarities.
Visual graph data
The genome browser produces visual representations showing genomic similarities. These graphs display:
- Peaks: Regions of high similarity between species
- Valleys or gaps: Regions where sequences differ
- Color coding: Often used to indicate different types of genetic elements (genes, regulatory regions, etc.)
The height of peaks indicates the degree of conservation - taller peaks mean the DNA sequence is more similar across the compared species. These peaks often correspond to functionally important regions of the gene that have been preserved through evolution.
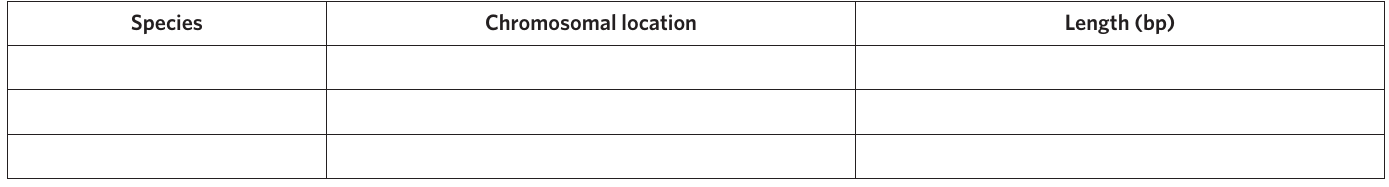
Molecular location data
The browser also provides specific information about where the corresponding gene is located in each species' genome:
- Chromosome number
- Starting position (base pair number)
- Ending position (base pair number)
- Total length of the gene region
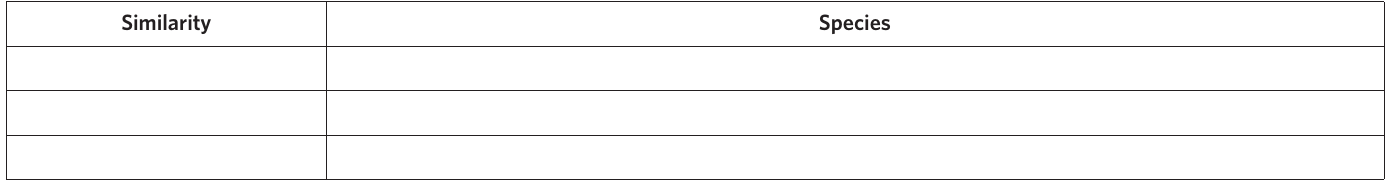
Recording similarity rankings
Based on the visual data and alignment scores, you can rank the species from most similar to least similar to humans at this specific gene location.
Recording chromosomal locations
It's important to document the precise molecular location of the TYR gene in each species, as this information reveals how genomic organization can vary even when gene sequences are similar.
Interpreting genomic alignments
What the data tells us
When examining genomic alignments, several patterns emerge:
- High similarity scores: Suggest the species are closely related evolutionarily and/or that the gene has an important function that has been conserved
- Different chromosomal locations: Even when gene sequences are similar, they may be located on different chromosomes in different species
- Length variations: The same gene can be slightly different lengths in different species due to insertions, deletions, or other mutations
Understanding conservation
Regions of high conservation (similarity) across multiple species typically indicate:
- The DNA sequence has an essential function
- Changes to this sequence may be harmful
- The sequence has been maintained by natural selection
- The species share a common evolutionary ancestor
Key Concept: Conservation and Function
When you see a region of DNA that is highly conserved across many species, this is strong evidence that the sequence performs a critical biological function. Evolution tends to preserve sequences that are essential for survival, while allowing less important regions to accumulate mutations over time.
Advantages of using genomic databases
Speed and efficiency
Genomic databases allow researchers to:
- Analyze millions of base pairs in seconds
- Compare multiple species simultaneously
- Access data from anywhere with internet connection
- Avoid time-consuming laboratory procedures
Traditional laboratory sequencing methods can take weeks or months and cost thousands of dollars. Using existing genomic databases, the same comparative analysis can be completed in minutes at no cost, making genomic research accessible to students and researchers worldwide.
Repeatability and reproducibility
Database investigations are highly repeatable because:
- The data is standardized and consistent
- Other researchers can access the same information
- The analysis can be repeated multiple times with identical results
- Different researchers can verify findings independently
Broad applications
Genomic databases support:
- Evolutionary biology research
- Medical genetics and disease studies
- Agricultural improvements
- Conservation biology
- Understanding gene function
Scientific communication through visualization
Importance of visual data
Scientific visualizations, such as genome browser graphs, serve crucial functions:
- Make complex data accessible and understandable
- Reveal patterns not obvious in raw numbers
- Allow quick comparisons between datasets
- Communicate findings to diverse audiences
The human brain processes visual information much faster than numerical data. A graph showing genomic alignment peaks can immediately reveal patterns that might take hours to identify from tables of numbers alone. This is why visualization tools are essential in modern genomics research.
Multiple data representations
The same genomic data can be presented in different ways:
- Visual graphs showing alignment peaks and valleys
- Tables listing specific molecular locations
- Numerical similarity scores
- Phylogenetic trees showing evolutionary relationships
Each representation highlights different aspects of the data and serves different analytical purposes.
Key Points to Remember:
-
A genome is the complete set of DNA in an organism's haploid chromosomes, containing all genetic information needed for life.
-
Genome size varies greatly between species and doesn't directly correlate with organism complexity - humans have over 3 billion base pairs, while fruit flies have only 165 million.
-
Comparative genomics uses genomic databases to compare DNA sequences across species, revealing evolutionary relationships and gene function.
-
The Human Genome Project created extensive public databases that enable high-resolution genomic comparisons using specialized software.
-
Greater genomic similarity between species indicates closer evolutionary relationships, while significant differences suggest more distant common ancestors.
-
Conservation of DNA sequences across species indicates essential biological functions that have been preserved by natural selection.
-
Computational modelling allows researchers to analyze millions of base pairs quickly and accurately without laboratory equipment.