Are You a Supertaster? (VCE SSCE Biology): Revision Notes
Are You a Supertaster?
Introduction to taste genetics
Genetics influences many aspects of how our bodies work, from eye colour to hair loss patterns. This investigation explores how genetic inheritance affects our ability to taste certain compounds.
Understanding the genetic basis of taste perception provides insight into how DNA influences our everyday sensory experiences and helps explain why people have such different food preferences.
Basic genetic inheritance
Diploid organisms receive two copies of each gene, called alleles, from their parents. When both alleles are identical, an individual is homozygous for that gene. When the two alleles differ, an individual is heterozygous. In heterozygous individuals, one allele may be expressed over the other. The expressed allele is dominant, while the masked allele is recessive. This pattern of dominance and inheritance explains many physical traits and behaviours.
The anatomy of taste
Our tongues contain small bumps called papillae. These papillae have taste buds on their surface, which contain specialised gustatory cells. The tips of gustatory cells are covered with taste receptors that project onto the tongue's surface.
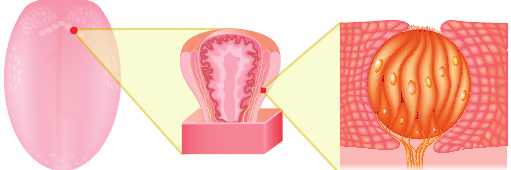
The taste sensation hierarchy:
The pathway from tongue surface to taste perception follows this structure:
- Papillae (visible bumps on tongue)
- Taste buds (sensory organs within papillae)
- Gustatory cells (specialized receptor cells)
- Taste receptors (protein molecules that detect chemicals)
When molecules from food interact with these taste receptors, they generate nerve signals that travel to the brain. This allows us to perceive five distinct taste modalities:
- Sweet
- Salty
- Sour
- Bitter
- Umami
Genetic variation in taste receptors
The shape of taste receptors varies between individuals due to differences in their genetic makeup. This variation means different people can experience the same food quite differently.
Genetic variation in taste receptor genes doesn't just affect whether you taste something—it can completely change how food tastes to you compared to others. What's mildly bitter to one person might be intensely unpleasant to another.
PTC tasting and the TAS2R38 gene
A clear example of genetic variation in taste is how people respond to phenylthiourea (also called phenylthiocarbamide), abbreviated as PTC. This non-toxic compound resembles alkaloid compounds found in some poisonous plants.
For some people, PTC tastes extremely bitter. For others, PTC has no taste at all, even when placed directly on the tongue.
A single gene called TAS2R38 is responsible for this difference. This gene codes for the TAS2R38 bitter taste receptor and has two common alleles plus at least five rarer variants.
What are supertasters?
While PTC doesn't occur naturally in foods, the ability to taste it indicates greater sensitivity to flavours in general. People who can taste PTC are called supertasters because they are far more sensitive to flavours than people who cannot taste it. This heightened sensitivity may have provided an evolutionary advantage by helping our ancestors avoid toxic plants.
Investigation aim
To calculate the frequency of PTC tasters and non-tasters in a population and determine the pattern of inheritance of the TAS2R38 gene.
Materials
- PTC taste paper
- Control taste paper
- Paper towel
- 1 cup of water
Safety considerations
Your teacher will wear gloves when handling the taste papers to avoid contamination. You should only handle the unhandled end of the papers to maintain experimental validity and hygiene.
Method
Preparation:
- Draw a line on your paper towel to divide it into two sections. Label one section 'Control' and the other 'PTC paper'.
- Your teacher will put on gloves and place one PTC taste paper and one control taste paper in their corresponding sections on your labelled paper towel.
Testing procedure:
- Sip some water to rinse your mouth out thoroughly.
- Place the unhandled end of the control paper on your tongue. Move it around slightly and ensure it mixes with your saliva. After 10 seconds, remove the paper and discard it.
- Record in Table 1 what the control strip tasted like. Rate it as either 'bitter' or 'no taste'.
- Sip water again to rinse your mouth completely.
- Place the unhandled end of the PTC taste paper on your tongue. Again, move it around and ensure it mixes with your saliva. After 10 seconds, remove the paper and discard it.
- Record in Table 1 what the PTC strip tasted like. Rate it as either 'bitter' or 'no taste'.
- Once your whole class has completed the activity, complete Table 1 with the class results.
Results
| Taste Rating | Bitter | No taste |
|---|---|---|
| Personal taste | ||
| Class taste (total) | ||
| Class taste (%) |
Calculating percentage:
Use the following formula to calculate the percentage for each category:
For example, if 18 out of 25 students taste PTC as bitter:
Analysis questions
1. Patterns of dominance
Compare and contrast complete dominance, codominance, and incomplete dominance:
- Complete dominance: One allele completely masks the expression of another allele in heterozygous individuals
- Codominance: Both alleles are expressed equally in heterozygous individuals
- Incomplete dominance: Heterozygous individuals show a blended phenotype intermediate between the two homozygous forms
2. Why PTC tasting varies
Some people can taste PTC while others cannot because of genetic variation in the TAS2R38 gene. Different alleles of this gene code for slightly different versions of the TAS2R38 taste receptor. These receptor variants have different shapes, affecting their ability to bind to PTC molecules. When PTC binds to functional receptors, it triggers a bitter taste sensation. Non-functional receptor variants cannot bind PTC, so no taste is detected.
3. Evolutionary advantage of PTC tasting
The presence of TAS2R38 taste receptors might increase an individual's chance of survival because these receptors detect compounds similar to toxic alkaloids found in poisonous plants. Individuals who can taste these bitter compounds would be more likely to avoid eating poisonous plants, reducing their risk of poisoning and increasing their survival and reproductive success.
This is an example of natural selection in action—the ability to detect bitter compounds provided a survival advantage, so this trait became more common in the population over time.
4. Analysing class data
Examine your class data to determine the pattern of gene expression for the TAS2R38 gene. If the majority of students can taste PTC, this suggests the taster allele is dominant. A roughly 3:1 ratio of tasters to non-tasters would support complete dominance, as this matches the expected ratio from a heterozygous cross.
5. Genotypes of tasters and non-tasters
Based on the pattern of gene expression suggested by your class data:
- Tasters: TT (homozygous dominant) or Tt (heterozygous)
- Non-tasters: tt (homozygous recessive)
This assumes the taster allele (T) shows complete dominance over the non-taster allele (t).
6. Punnett square analysis

Worked Example: Punnett Square for PTC Tasting
Complete the Punnett square for a cross between two heterozygous parents ():
| T | t | |
|---|---|---|
| T | TT | Tt |
| t | Tt | tt |
Step 1: Determine possible gametes
- Each parent can produce T or t gametes
Step 2: Fill in offspring genotypes
- Combine each gamete from one parent with each gamete from the other
Step 3: Determine ratios
Genotypic ratio:
Phenotypic ratio:
This means if both parents are heterozygous tasters, there is a 75% chance their child will be a taster and a 25% chance their child will be a non-taster.
7. Pedigree analysis
Examine the pedigree carefully. Use the following principles:
- Filled symbols represent tasters
- Empty symbols represent non-tasters
- If two taster parents have a non-taster child, both parents must be Tt
- Non-taster individuals (tt) can only pass on t alleles
- If genotype cannot be determined with certainty, use T_ notation
Common mistake to avoid:
Don't assume all tasters have the same genotype! Tasters can be either TT or Tt. You can only determine the exact genotype if:
- The individual has non-taster parents (must be tt)
- The individual is a taster with a non-taster child (must be Tt)
- The individual is a non-taster (must be tt)
8. Variation in tasting intensity
Among tasters, some people may taste PTC more strongly than others. This can be explained by genotype differences:
- TT individuals (homozygous dominant) have two copies of the functional receptor gene, producing more taste receptors and experiencing a stronger bitter taste
- Tt individuals (heterozygous) have only one copy of the functional gene, producing fewer receptors and experiencing a weaker bitter taste
This phenomenon demonstrates that even with complete dominance at the phenotypic level (taster vs. non-taster), there can still be subtle differences between homozygous and heterozygous individuals when you look more closely.
9. Experimental limitations
Limitation: The binary classification (bitter or no taste) doesn't capture the range of tasting intensity experienced by participants.
Improvement: Use a scale (e.g., 0-10) to rate taste intensity, allowing for more detailed data collection and better differentiation between TT and Tt genotypes.
Worked Example: Improved Rating Scale
Instead of "bitter" or "no taste", students could use:
- 0 = No taste at all
- 1-3 = Slightly bitter
- 4-6 = Moderately bitter
- 7-9 = Very bitter
- 10 = Extremely bitter
This would allow researchers to:
- Identify potential TT individuals (scores 7-10)
- Identify potential Tt individuals (scores 4-6)
- Identify tt individuals (scores 0-3)
- Collect more nuanced data for statistical analysis
10. Experimental design consideration
The instruction to use the "unhandled end" of the paper addresses contamination control. This prevents:
- Transfer of PTC from the teacher's gloves to the control paper
- Transfer of oils or substances from students' hands to the papers
- Cross-contamination between students
Further incorporation:
- Use separate, sterile forceps for each paper type
- Have students wash hands before the experiment
- Ensure papers are stored separately until use
- Use gloves throughout handling
Conclusion framework
Write a concluding paragraph that includes:
- Achievement of aim: State whether you successfully calculated the frequency of PTC tasters and non-tasters, and whether you determined the likely pattern of inheritance (complete dominance, with taster being dominant)
- Limitations: Identify weaknesses such as small sample size, binary classification system, or potential contamination issues
- Improvements: Suggest using a rating scale, larger sample sizes, DNA testing to confirm genotypes, or testing family groups to trace inheritance patterns
- Broader implications: Discuss how this relates to understanding genetic variation in populations, evolutionary adaptations, personalized nutrition, or how genetics influences sensory experiences and food preferences
A strong conclusion connects your specific experimental results to broader biological concepts and real-world applications. Consider how understanding taste genetics might be useful in fields like nutrition science, evolutionary biology, or medicine.
Remember!
Key Points to Remember:
- Genetics determines taste perception through genes that code for taste receptor proteins
- The TAS2R38 gene has different alleles that affect the ability to taste PTC, a bitter compound
- Taste sensation involves papillae → taste buds → gustatory cells → taste receptors working together
- Supertasters can detect PTC and are generally more sensitive to flavours
- Punnett squares and pedigrees help predict and analyze inheritance patterns
- Proper experimental design requires controlling variables like contamination to ensure valid results
- Understanding taste genetics has implications for evolution, nutrition, and individual dietary preferences
- The typical inheritance pattern shows 3:1 phenotypic ratio for heterozygous crosses
- Genotype differences (TT vs. Tt) can explain variations in tasting intensity among tasters