Surveying Biodiversity (VCE SSCE Biology): Revision Notes
Surveying Biodiversity
What is biodiversity?
Biodiversity refers to the variety and variability of plant and animal life on Earth, or of a particular location. At an ecosystem level, biodiversity is measured by counting the number of different species that live in an area. This measurement provides important insights into the health of an ecosystem.
Greater plant diversity in an area typically supports more diverse animal life as you move up through trophic levels. This interconnection means that changes in plant biodiversity can have cascading effects throughout the entire ecosystem.
Understanding biodiversity is essential for both environmental conservation and human wellbeing.
Why conduct biodiversity surveys?
Scientists survey and sample habitats to quantify biodiversity levels. The information gathered from biodiversity surveys helps us to:
- Assess conservation values of different areas
- Understand how land use changes affect ecosystems
- Document natural heritage
- Aid in resource management decisions
Whilst some survey techniques are complex and require specialist expertise, basic sampling methods are straightforward and can be conducted by anyone with proper training.
Strip transect sampling
One practical method for surveying biodiversity is strip transect sampling. Rather than attempting to count every organism in an entire ecosystem (which would be extremely time-consuming), this technique involves surveying a smaller representative area. The data collected from this sample provides insights into the ecosystem as a whole.
Representative Sampling
Strip transect sampling works on the principle that a carefully selected smaller area can provide reliable information about the larger ecosystem. By standardizing the survey area size, we can make meaningful comparisons between different habitats.
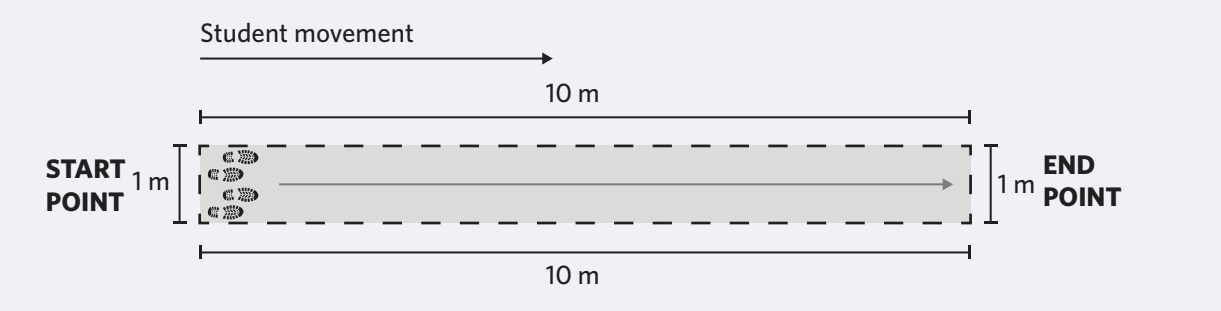
A strip transect creates a survey area that is 10 metres long and 1 metre wide, giving a total area of 10 m². This is established by:
- Selecting a starting point within the habitat
- Measuring a 10 m line from the starting point to an endpoint
- Measuring 0.5 m (half a metre) on either side of this line
- This creates a rectangular survey strip
The surveyors then slowly walk along this strip, searching for evidence of both plant and animal species.
Materials required for biodiversity surveys
- 10 m measuring tape
- 1 m measuring tape
- Clipboard and paper or logbook for recording data
- Camera or phone (optional, for photographing species)
Selecting survey sites
To investigate how human activity affects biodiversity, three different sites should be selected:
Site 1 - Low human impact: An area that appears mostly untouched by humans, such as a forested area or natural grassland
Site 2 - Moderate human impact: An area with some human influence, such as a grassland next to buildings or a park
Site 3 - High human impact: An area heavily affected by human activity, such as a football oval or car park
The three sites should be wide, open areas of similar size, accessible to surveyors, and not too far apart.
Safety First
Safety must be assessed for each location before conducting the survey. Consider potential hazards such as uneven terrain, traffic, wildlife, weather conditions, and accessibility. Always survey in groups and inform someone of your survey locations and expected return time.
Survey procedure for animals
Within the strip transect area, surveyors search thoroughly for evidence of animal life. The survey should be conducted slowly and carefully. Signs of animal life include:
- Animals themselves that are present
- Footprints and trails
- Burrows and hollows
- Nests or eggs
- Faeces
- Feathers, fur, dead skin, and other remains
- Rubbish (evidence of human presence)
Thorough Searching Techniques
Surveyors should lift leaves, branches and rocks to look for insects and other small animals. They should also check above the survey area for birds flying overhead, and examine any trees present or overhanging the area. The most complete surveys come from checking all vertical layers of the habitat, from the ground to the canopy.
The goal is to record all different types of species present, not to identify them precisely. Teams must make their best judgement about whether different signs come from different species.
Survey procedure for plants
After surveying for animals, the same strip transect is searched for plant species. Surveyors should:
- Look closely at the shape of seeds, flowers, and leaves to distinguish different species
- Note different types of grasses and other plants
- Check directly above the strip area for overhanging vegetation
- Record each distinct plant species observed
Recording abundance
For each species observed (both plant and animal), the survey team assigns an abundance rating based on how common it was in the survey strip compared to other species. The three abundance categories are:
- L (Low): Few individuals or signs observed
- M (Medium): Moderate number of individuals or signs
- H (High): Many individuals or signs observed
These ratings are relative measures - they describe how abundant each species is compared to the others found in that particular survey area, rather than absolute population counts.
Recording results
Results are recorded in a table format showing the species list and abundance for both animals and plants. Here is an example of data collected at a single location:
| Animals | Plants | ||
|---|---|---|---|
| Species list | Abundance | Species list | Abundance |
| Small ant | H | Short grass | H |
| Magpie | L | Tree 1 | M |
| Humans | M | Tree 2 | L |
| Larger ant | M | Small weedy plant | M |
| Millipede | L | Taller lush grass | M |
| Small spider | L | Tree 3 | M |
| Brown bird | L | Large bush | M |
| Total animal species = 7 | Flowering weed | M | |
| Prickly weed | L | ||
| Total plant species = 9 |
This same procedure is repeated at each of the three survey sites, and the data is compared to understand how biodiversity varies with human impact.
Understanding biodiversity metrics
Ecologists use two important metrics to assess biodiversity, rather than relying on a single measure.
Species richness
Species richness is defined as the number of different species in a region. This is simply the total count of distinct species (both plant and animal) recorded in the survey area.
Worked Example: Calculating Species Richness
Using the data table above:
- Animal species counted: 7 species
- Plant species counted: 9 species
- Total species richness = 7 + 9 = 16 species
Species richness is always expressed as a simple count of the number of different species present.
Species evenness
Species evenness refers to how balanced the numbers of each species in a habitat are. The more 'even' the species populations are, the greater the biodiversity, because it indicates that one or two species are not dominating over all the others.
To measure evenness precisely, ecologists count each individual member of each species, which can be very time-consuming. In a basic survey using abundance ratings (L, M, H), evenness can be estimated by looking at how many species have similar abundance levels versus how many are rare or dominant.
A habitat with high species evenness would have many species with similar abundance ratings. A habitat with low species evenness might have one or two species rated as high abundance whilst most others are rated as low abundance.
Why both metrics matter
The Importance of Combined Metrics
Two habitats might have the same species richness (same number of species), but very different species evenness. The habitat with higher evenness typically represents a healthier, more stable ecosystem. Both measurements together provide a more complete picture of biodiversity than either one alone.
A habitat could have 20 different species (high species richness) but if 95% of all individuals belong to just one species, it would have low species evenness and therefore lower overall biodiversity than the numbers might initially suggest.
Human impact and biodiversity
This investigation examines the relationship between human impact on habitats and their biodiversity levels. By comparing survey results from sites with low, moderate, and high human impact, patterns can emerge showing how human activity affects:
- Total number of species (species richness)
- Balance of species populations (species evenness)
- Types of species present
Generally, ecosystems with greater human disturbance show reduced biodiversity, though the specific effects can vary depending on the type and intensity of human activity.
Remember!
Key Points to Remember:
- Biodiversity refers to the variety and variability of life in a particular location and indicates ecosystem health
- Strip transect sampling provides a practical method to survey biodiversity by examining a 10 m × 1 m area (10 m²)
- Species richness measures how many different species are present in an area
- Species evenness measures how balanced the populations of different species are
- Both metrics together provide a complete picture of biodiversity - an area can have many species but low biodiversity if one or two species dominate
- Biodiversity surveys help us understand human impacts on ecosystems and guide conservation decisions